
WorkersSlackMicrosoft TeamsWeb app
Edit custom instructions from chat
You could already tailor a Worker by editing its custom instructions on the Workers page. Now you can just tell it what you want in chat — from Slack, Microsoft Teams, or a web Worker — and it updates those instructions itself. Last-mile tailoring happens directly in the tools where you already work.Say what you want in plain language. For example, you can ask your Worker to:- Prioritize or ignore certain alerts — tell an Alert Worker which alerts matter and which ones to leave alone.
- Tag the responsible team — have an Incident Worker notify the right people as more information emerges.
- Check the deployment dashboard first — point a Worker at the evidence you’d reach for yourself.
WorkersSlack
Custom Workers
Workers are a powerful, flexible harness for Traversal’s Production World Model and Causal Search Engine. Incident Workers and Alert Workers package that intelligence into opinionated experiences for specific SRE use cases. Custom Workers open the same capabilities to the long tail of work your team wants Traversal to take on.Give a Custom Worker a mission in plain language, and it follows the channel and acts on that direction. Deploy one into:- A deployment channel — to watch a rollout as it goes out and flag the change that caused a regression.
- A support channel — to surface the recurring problem behind a run of customer reports.
- A team or project channel — to follow ongoing operational work and keep a running picture of where it stands.
Major releaseWorkersWeb appSlackMicrosoft Teams
The Traversal Workers release
Incident Workers in general availability, Alert Workers in public beta, and a new web experience for both.Scan your workspace, and Traversal proposes the Alert and Incident Workers to deploy plus the naming conventions to auto-deploy against.
SlackKnowledge Bank
Approve memories from Slack
When Traversal proposes a memory during a Slack investigation, you can now approve or reject it in the same thread. The card shows the memory name and the text being saved. The memory stays pending until a person decides — same as in the web app.See using Traversal in Slack.IntegrationsAWS
Amazon CloudWatch integration
Traversal now connects directly to Amazon CloudWatch to pull metrics and logs during investigations, using a cross-account IAM role. Deploy a CloudFormation template in the AWS account you want Traversal to read from, and it correlates CloudWatch signals with your other connected telemetry.See the setup guide to connect your first account.APIKnowledge Bank
Manage Knowledge Bank content through the API
The new Knowledge Files API lets you manage the knowledge your team contributes to Traversal programmatically. List, upload, download, replace, and delete runbooks, reference documents, and agent skills to keep Traversal in sync with your existing documentation workflows.The API covers team-authored documentation and skills. It does not expose Traversal’s Auto-created knowledge or agent memories.Major releaseWeb appKnowledge Bank
The new Knowledge Bank
Knowledge Bank is now one place to see everything Traversal knows about your systems — what it worked out on its own, and what your team has taught it.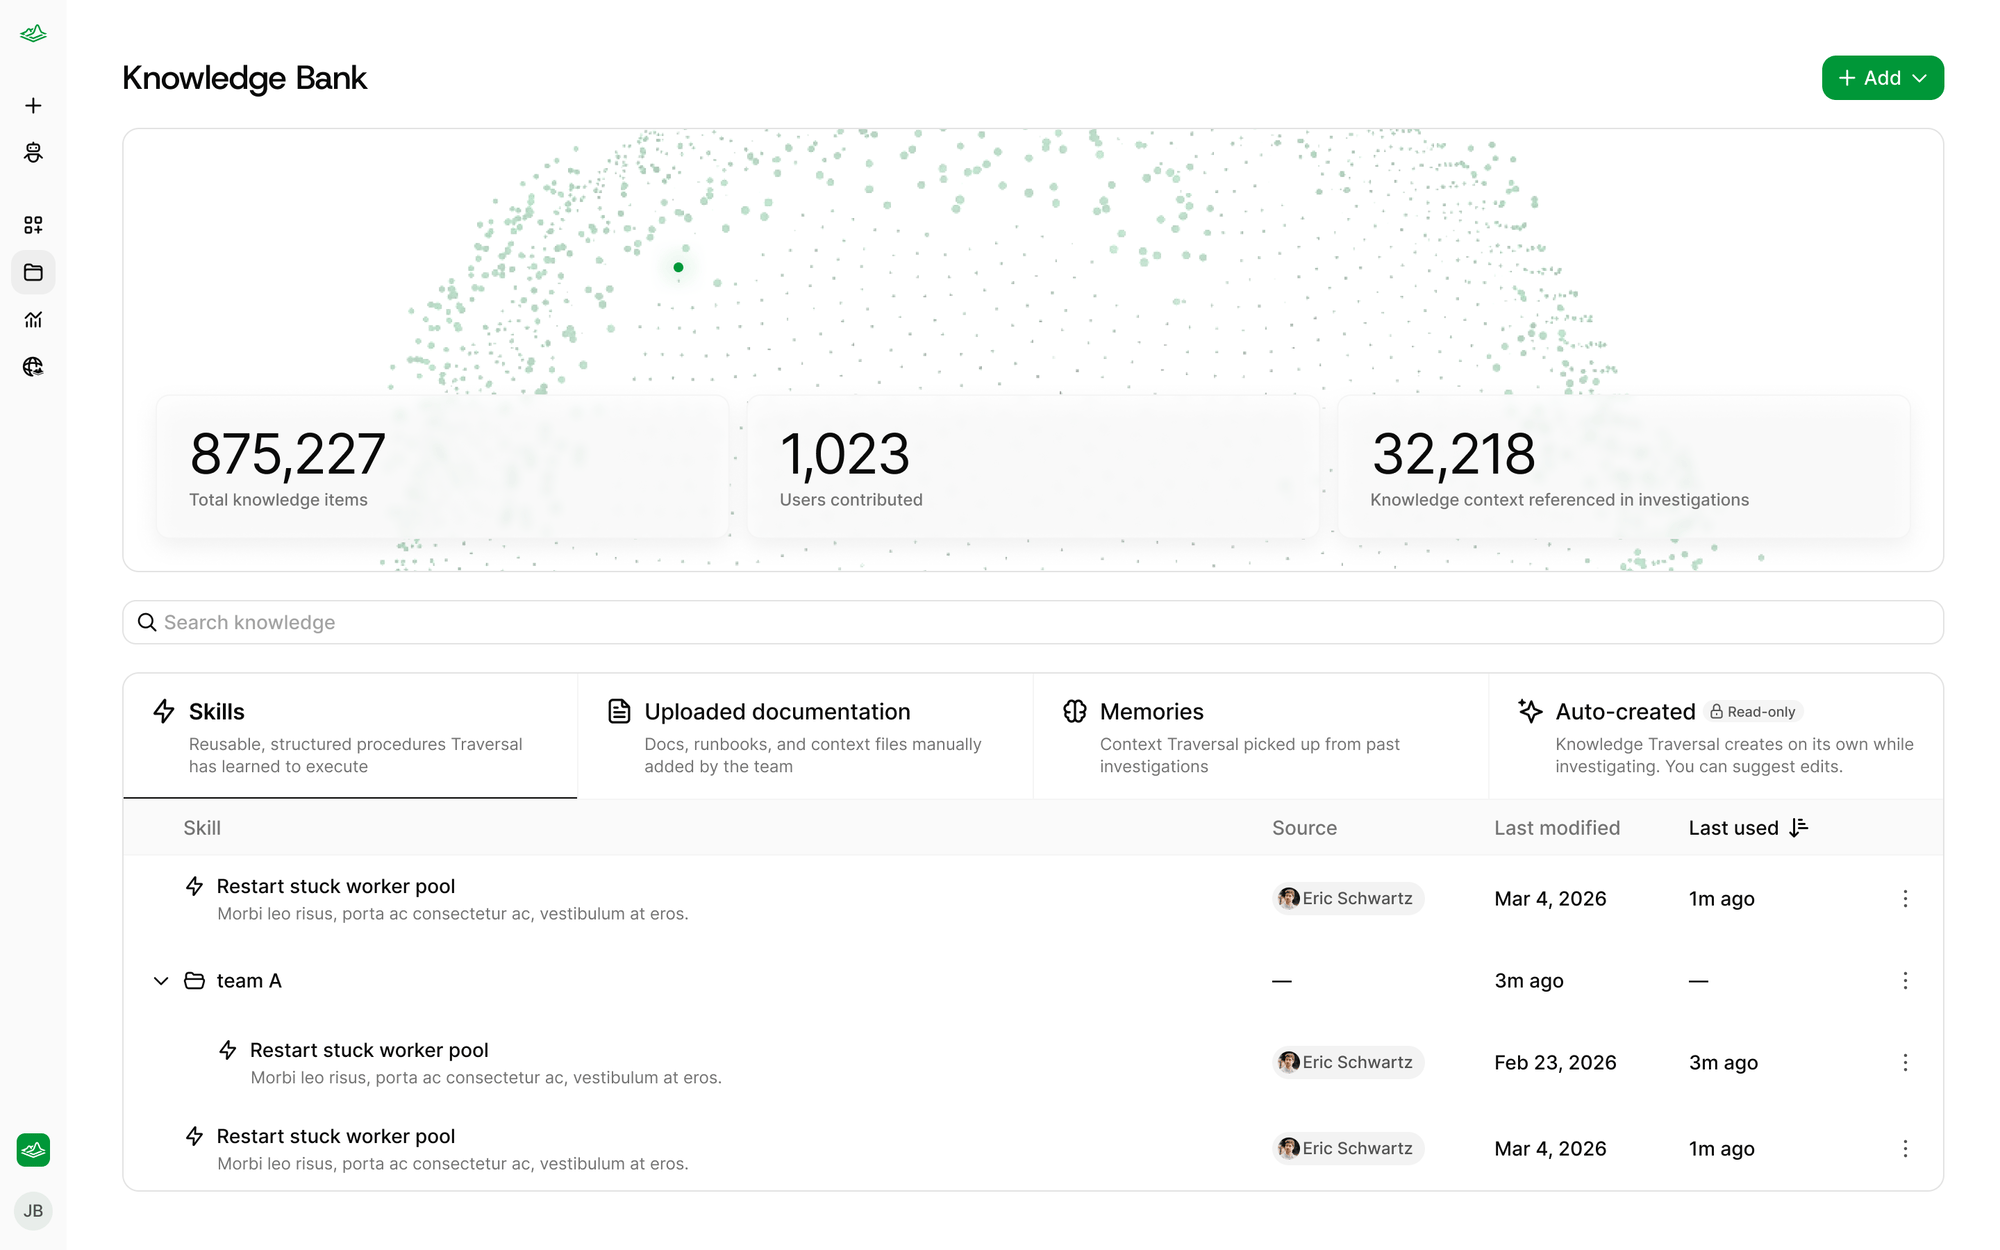
- Auto-created — Traversal’s own documentation of your environment, written from your connected integrations: code, metrics, logs, traces, alerts, tickets, and existing docs. It takes no input from your team to produce, and Traversal keeps regenerating it as your systems change — so anyone can read up on an unfamiliar service instead of asking around. Where you know something the data doesn’t show, leave a comment and Traversal folds it in.
- Skills — reusable procedures that shape the steps Traversal takes, so an investigation follows the way your team actually works.
- Documentation — runbooks, context files, and the constraints and workarounds your systems don’t record, expanding what Traversal has to reason over.
- Memories — what Traversal has learned working alongside you. It proposes what’s worth keeping and waits for a person to approve, so it gets sharper the more you use it.
Major releaseMicrosoft Teams
Traversal comes to Microsoft Teams
Traversal is now available in Microsoft Teams. Mention @Traversal in a channel, group chat, or direct chat with an incident description, and it runs a root-cause investigation across your connected observability tools — posting the report back into the thread with citations and a link to the full session in the web app. Ask follow-up questions in the same thread to dig deeper.A Teams administrator installs the app once; see the installation guide to get set up, and using Traversal in Teams for what you can do with it.APIInvestigations
Stream session status over the API
The Sessions API now provides a Server-Sent Events endpoint atGET /v1/sessions/{session_id}/events. Connect
once to receive the current status and each status change, instead of polling
while Traversal investigates.The stream sends keepalive comments during long-running investigations and
closes when the session becomes idle, failed, or cancelled. You can then
retrieve the final conversation with GET /v1/sessions/{session_id}.ProcessorMajor release
Throughput improvements for the Traversal Processor
Traversal Processor 0.4.0 ships alongside the 0.4.0 Helm chart with a rebuilt ingest and processing engine, delivering massive improvements to throughput and reliability under heavy load.- Higher throughput — up to ~80,000 records/s (~300 MB/s) per pod on the
largesize tier. - One-knob sizing —
size: normal|largesets CPU, memory, and internal tuning to validated presets. See sizing and throughput. - Deeper observability — a new and more detailed set of
processor.*metrics.
APIInvestigations
Choose investigation depth over the Sessions API
The Sessions API now accepts an optionalthinking_mode on
both session creation and follow-ups. Pass deep to force a thorough
root-cause analysis, fast for a quick exploratory pass, or leave it as the
default auto to let Traversal pick — existing integrations need no changes.Follow-ups now also count toward the same per-organization concurrency limit
as new sessions, so a burst of follow-ups is throttled with a 429 the same
way session creation already is.Web appAnalytics
A clearer picture of Traversal adoption
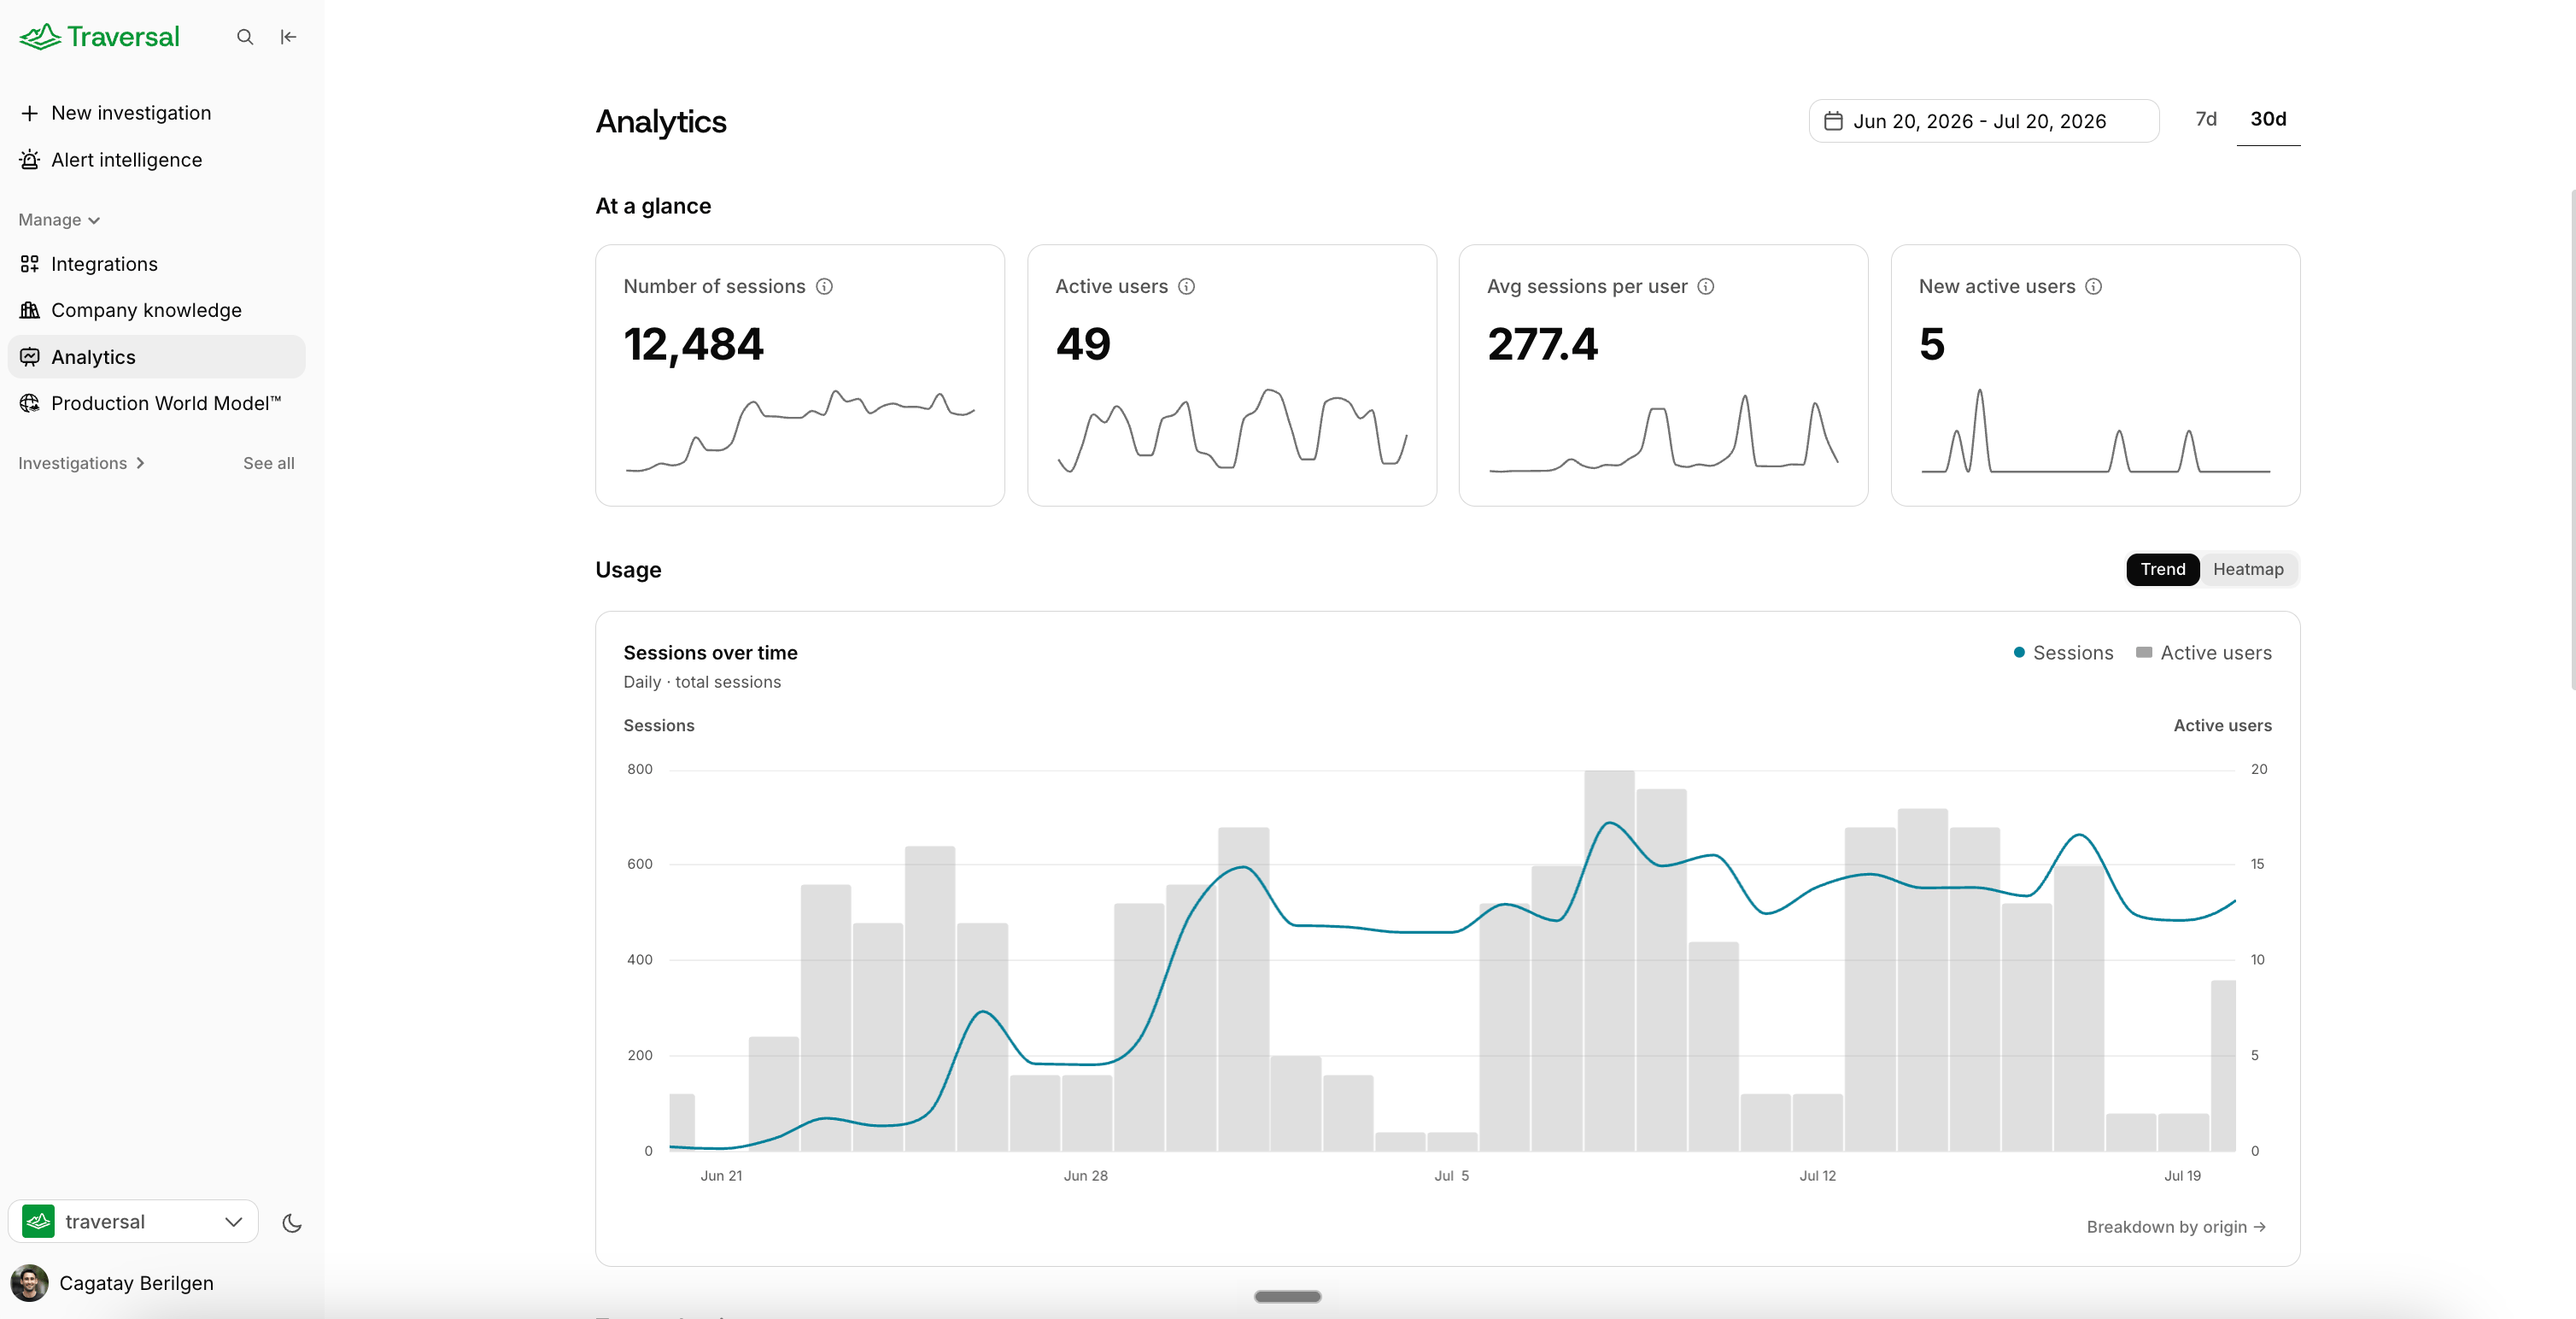
We’ve fully revamped the Analytics page, now available to Org Admins at app.traversal.com/analytics. It gives you a clear picture of how Traversal is being adopted and used across your organization, all in one place.- Usage over time — sessions and active users, with period-over-period comparison so you can track adoption week over week.
- Who’s using Traversal — top users and top channels, a Top Investigators panel, and an activity heatmap showing engagement across your team.
- Session detail — breakdowns by origin (Web, Slack, API, MCP) so you can see where investigations are being started.
WorkersSlackInvestigations
Workers read live incident transcripts
When your team runs an incident on a live video call, a Worker can now read the call’s transcript in real time and fold it into its work. It picks up what’s said out loud but never typed into Slack — the fix someone just tried, the theory forming on the call, even how people are reacting to Traversal’s own suggestions — and uses those cues to adjust course and stay current with where the room actually is.Live calls generate a lot of chatter, so under the hood Traversal distills the transcript down to what matters — cleverly filtering the noise rather than handing the Worker the raw feed — so it stays sharp and focused without overloading its context.Live transcripts are in private beta. Talk to your Traversal contact to connect your team’s calls.Web appUX/UI
Jump to anything with ⌘K
One for the power users: press ⌘K anywhere in the web app to open a quick search. Start a new investigation, jump to any past one by typing its name, or open your integrations, all from the keyboard. Arrow keys move through the list and Enter opens, so you never have to reach for the mouse.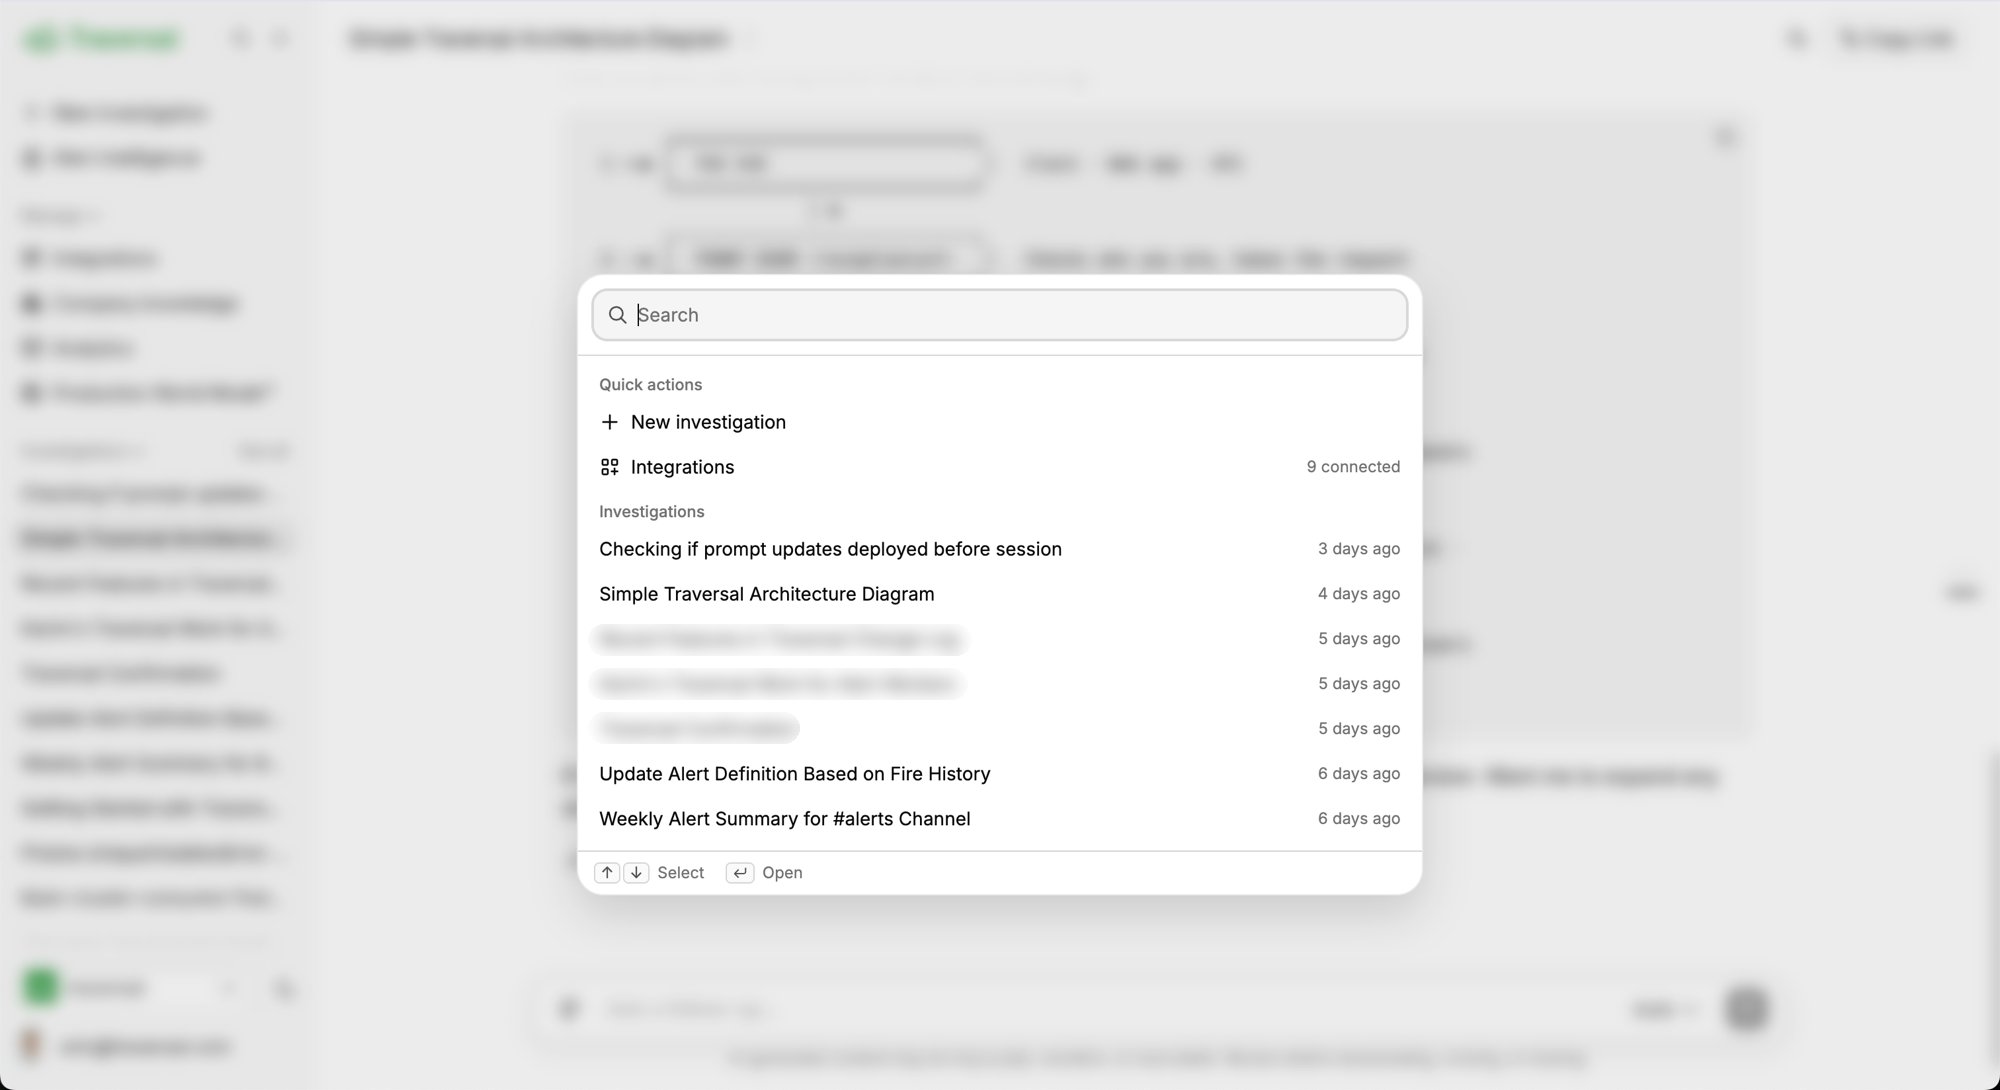
Web appUX/UI
24-hour time format
Prefer a 24-hour clock? A new Time format option in your personalization settings switches Traversal from 12-hour AM/PM to 24-hour. It flows through the entire app — evidence displays, investigation timelines, the times you type into an investigation, everywhere a timestamp appears — so times read the way you expect no matter where you are.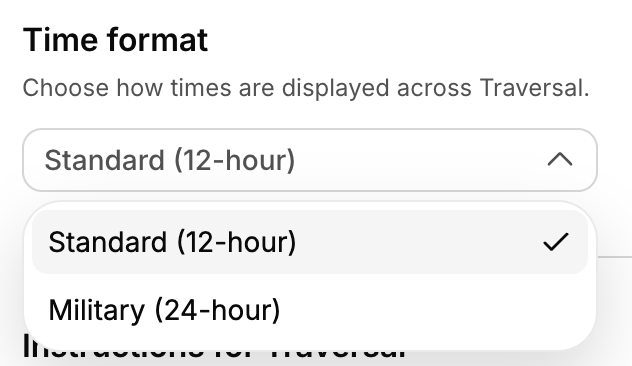
Security
Single-tenant SaaS deployment
A new deployment option that sits between multi-tenant SaaS and full BYOC: a dedicated, single-tenant Traversal instance running in an isolated, Traversal-operated AWS account — its own domain, no infrastructure shared with any other customer, SSO required, and data encrypted at rest (AES-256) and in transit (TLS 1.3). You get hard tenant isolation without having to run and maintain Traversal in your own cloud. See deployment options.Web appUX/UI
Navigate long sessions
When you’re deep in an investigation, it’s natural to keep asking follow-ups — and a session can grow into a long back-and-forth. A new navigator makes those long sessions easy to move through by their question-and-answer pairs — jump straight back to any exchange instead of scrolling, and hover to preview what’s there.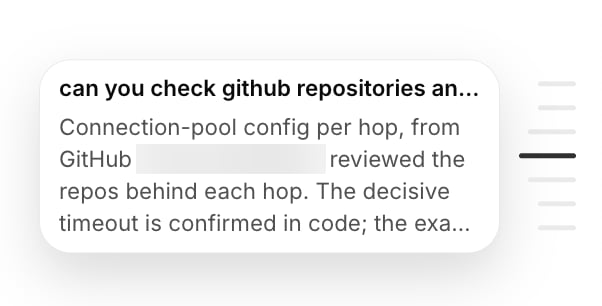
Major releaseWorkersSlack
Traversal Workers
A new, more capable way to work with Traversal. Rather than waiting to be summoned, a Worker joins a channel and works alongside your team like a teammate — reading the situation, gathering context, and doing what’s worth doing on its own. During an incident, a Worker joins the moment the channel is created, investigates autonomously, follows the incident in real time, and drafts a post-mortem when it resolves.Web appUX/UI
Timezone preference
Set a personal timezone in your personalization settings so every timestamp across Traversal shows in your local time instead of UTC — no more mental math when reading an incident timeline.MCPIntegrations
Connect your own MCP servers
Connect any external MCP server as a data source — a great way to tailor Traversal to your stack with tools and systems we don’t support out of the box. Point it at an internal service or a third-party MCP server and its tools become available to the agent during investigations.Web appUX/UI
New navigation rail
A redesigned left navigation rail makes it faster to move between your sessions, integrations, and settings, with a cleaner layout that stays out of your way.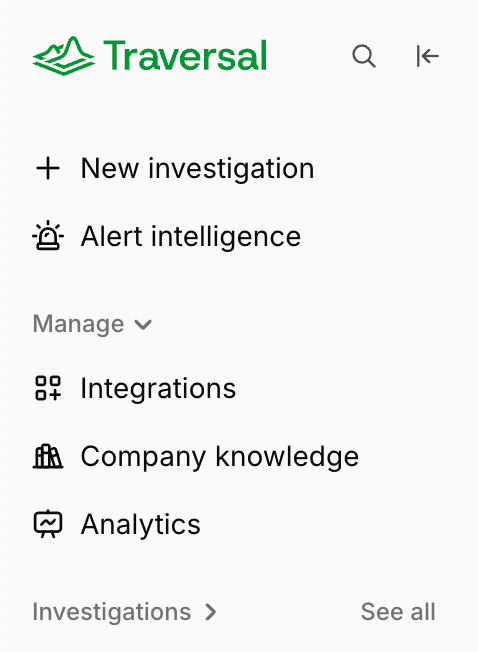
MCPInvestigations
SlackAlert IntelligenceUX/UI
Channel management
A new settings page to see every Slack channel Traversal is active in and manage them in one place — turn on Alert Intelligence for a channel and set its custom instructions, so every investigation in that channel follows the same guidance no matter who runs it.Web appUX/UI
Smoother follow-up quoting
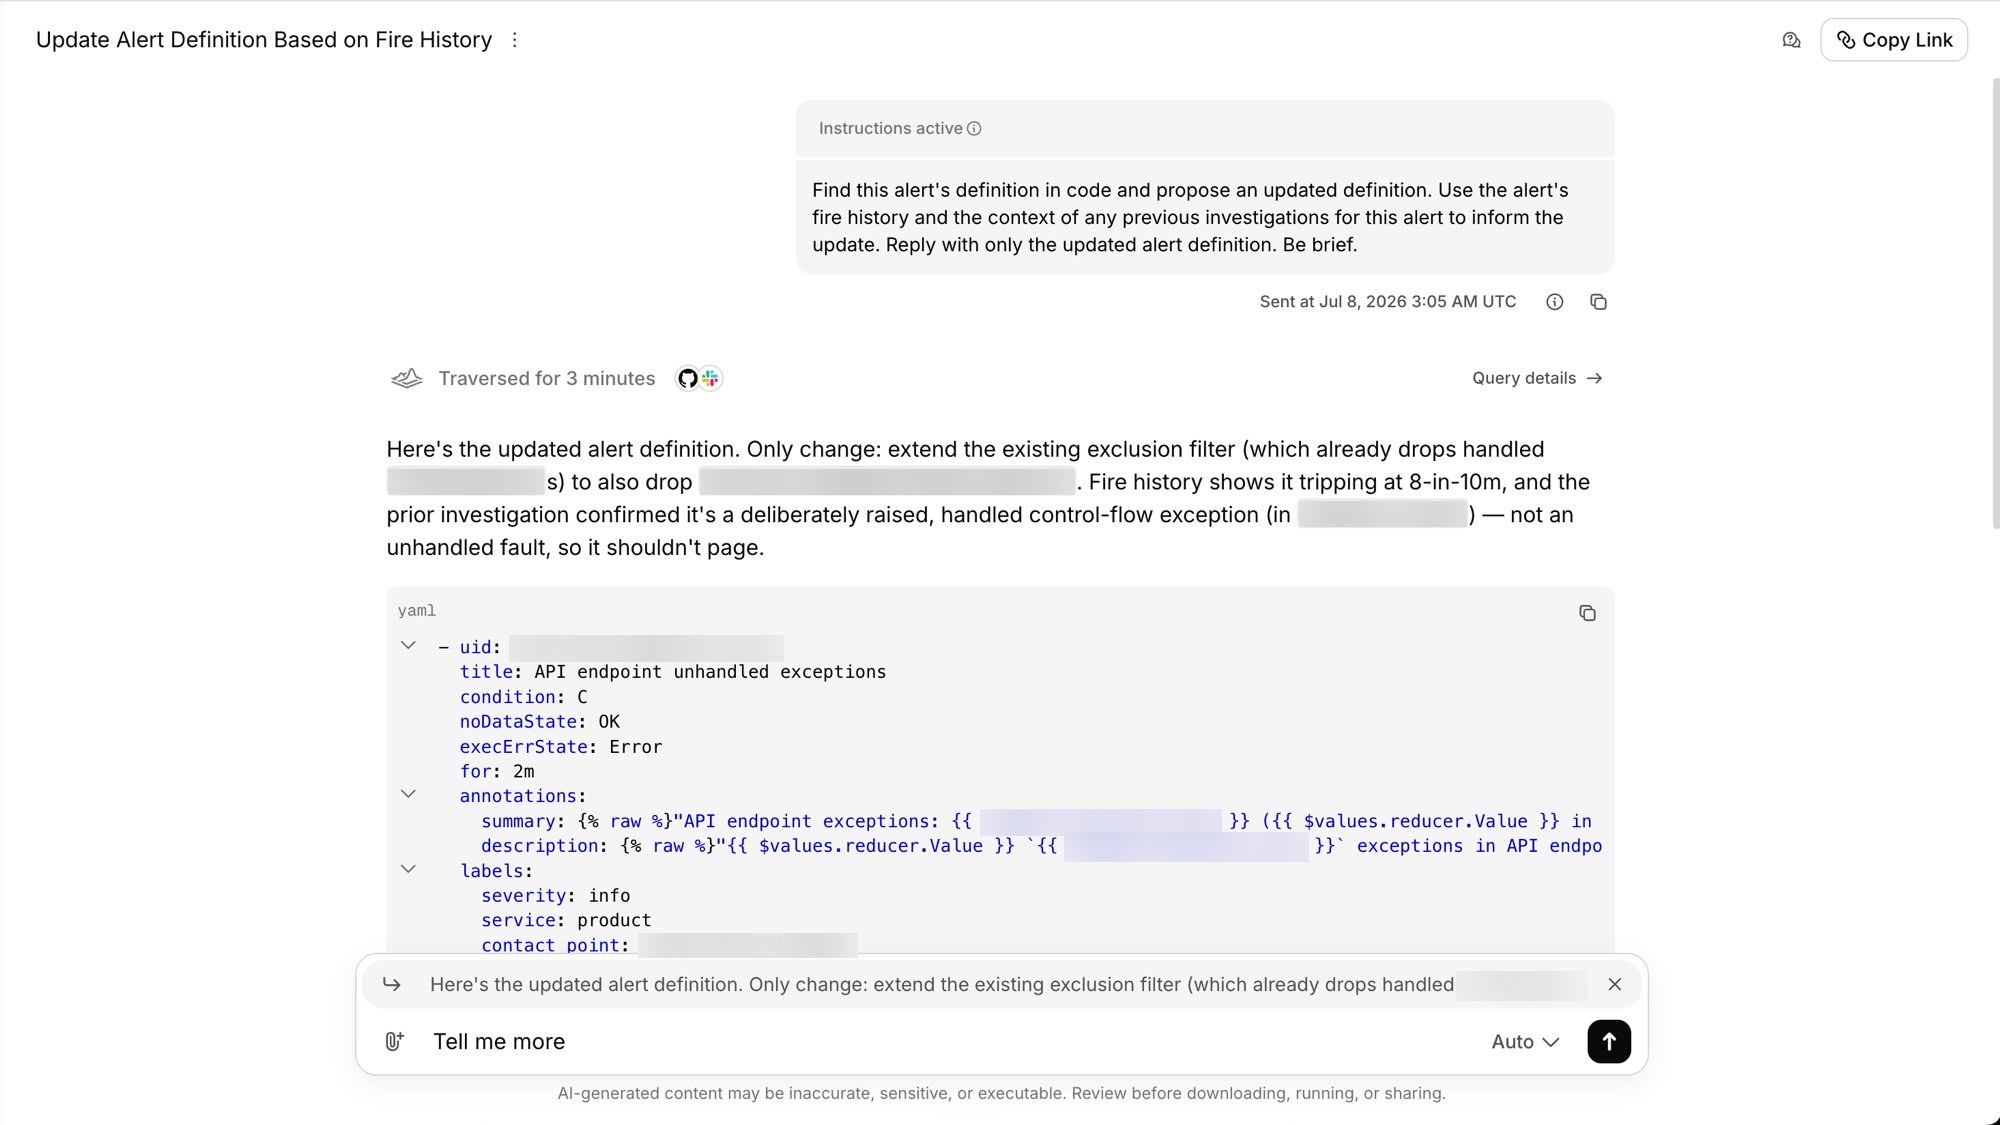
Quoting part of a previous response in your follow-up is smoother — highlight the text you want to reference, hit Add to chat, and it’s attached to your next message with the composer focused and ready, so it’s clear exactly what you’re asking about.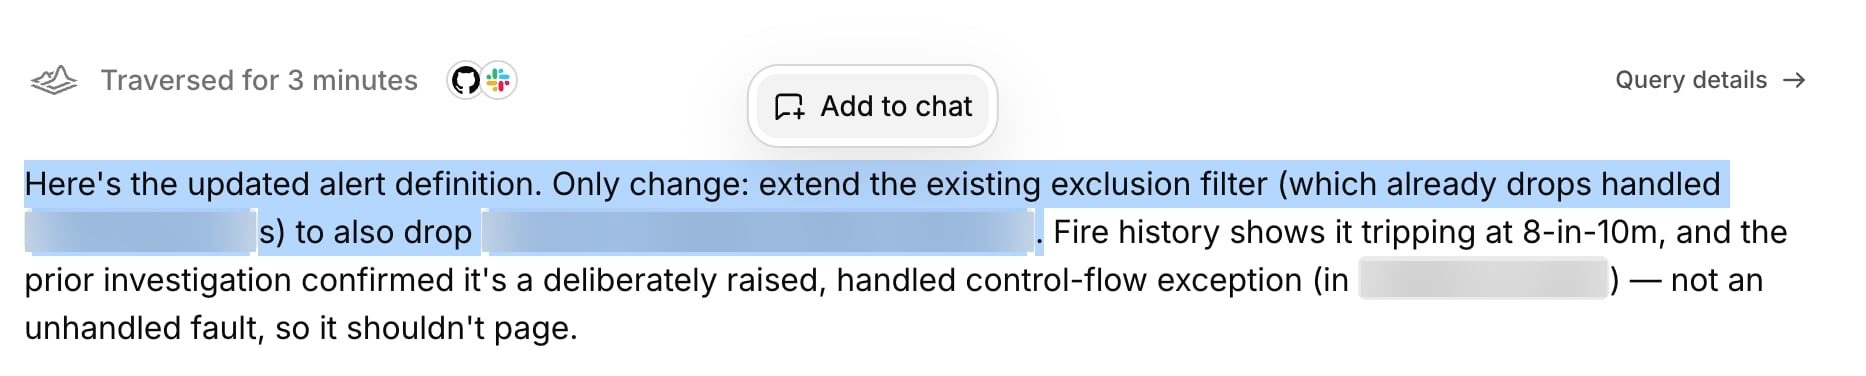
InvestigationsWeb app
Generate files to download
Traversal can now generate files you can download and share — reports, PDFs, spreadsheets, and more. Ask for a deliverable and the agent produces it inline, ready to download straight from the session.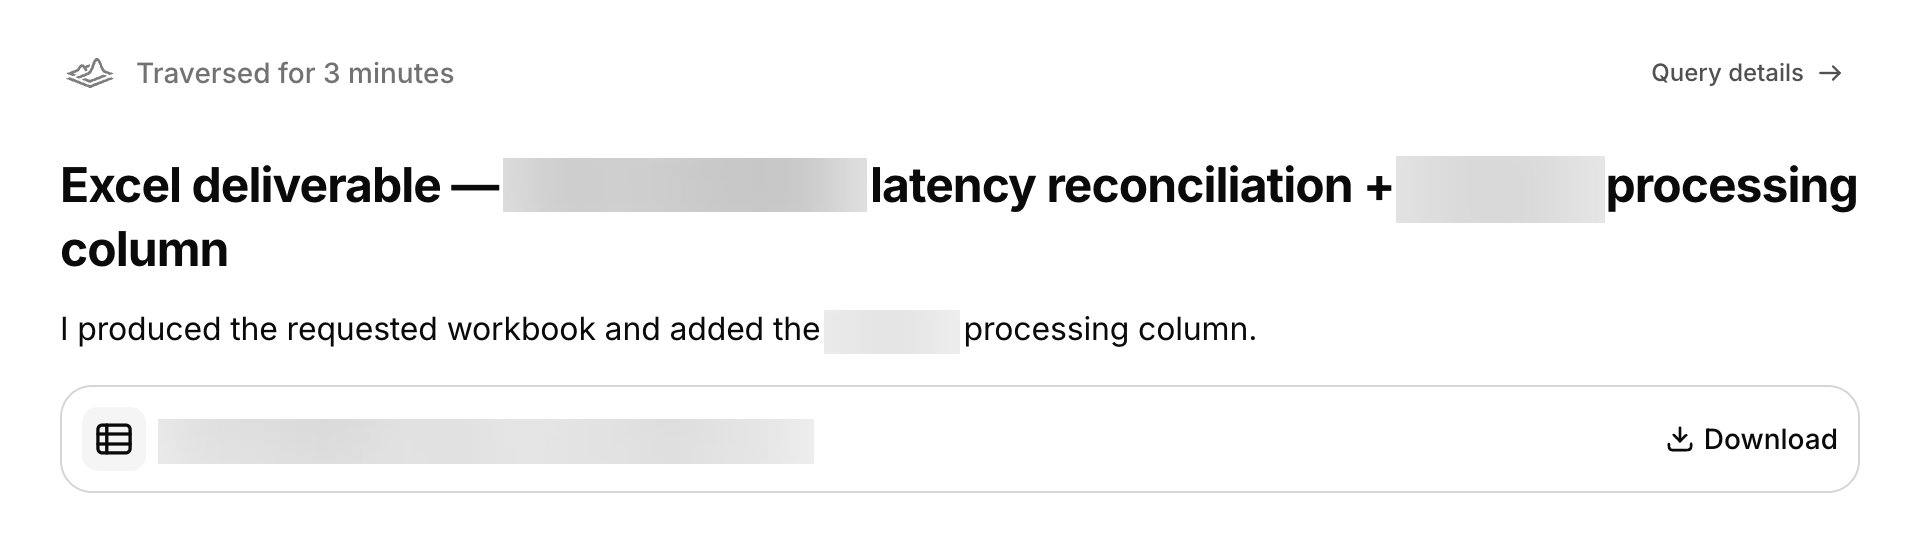
Web appSlackUX/UI
Slack session visualization
Sessions that originate in Slack now render with a custom Slack visualization in the web chat — showing who sent each message, which channel it came from, and whether any custom instructions were applied. Because Slack channels are multiplayer, knowing who said what matters — a shared incident channel has many voices, and the visualization keeps them straight. Alerts are rendered more cleanly too, so a Slack-triggered investigation reads clearly from the web app.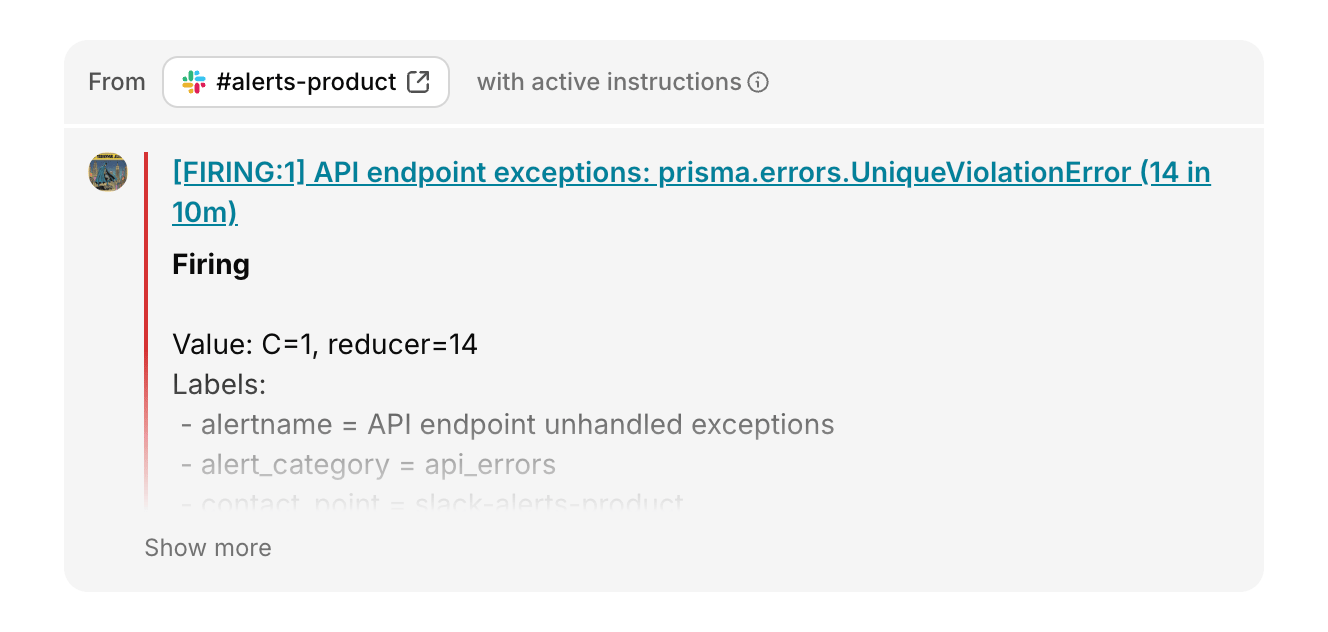
Investigations
Ask Traversal how it works
Traversal can now answer questions about its own documentation, so you can ask how a feature works right where you’re working. New users can even have Traversal onboard them — walking through what it does and how to get the most out of it.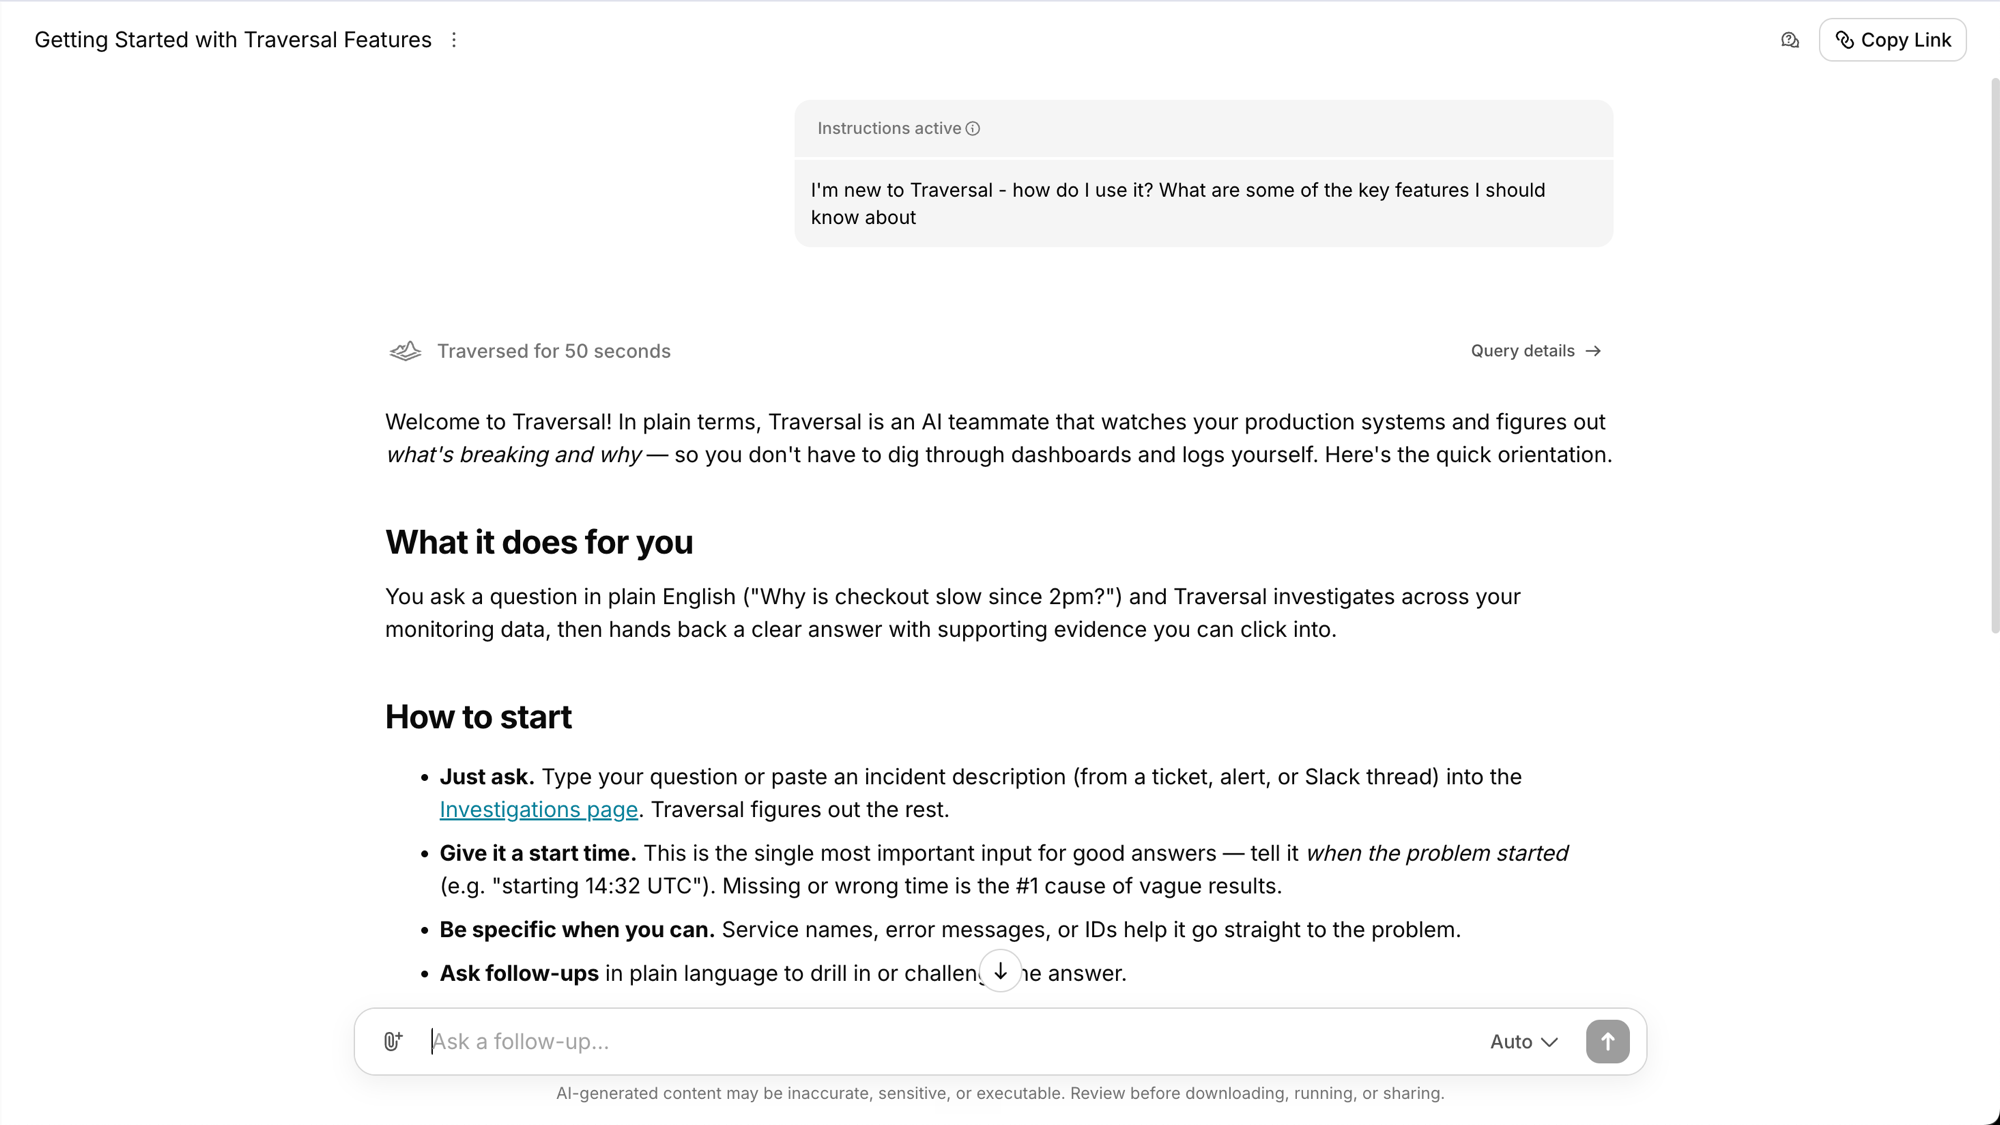
InvestigationsSlackWeb app
Custom instructions
Give Traversal standing instructions so you don’t have to re-type your preferences every time — point it at specific runbooks, prescribe steps, or set output preferences like “be brief” or “suggest an owning team.” Two layers:- Personalization — your own instructions, applied to every investigation you run, in Slack and the web app.
- Channel custom instructions — instructions applied to every investigation in a Slack channel, no matter who runs it. Admins can also toggle Alert Intelligence mode per channel from the same console.
MCP
Web appUX/UI
Overhauled chain-of-thought
Traversal’s “chain-of-thought” loading state has been redesigned to be more legible and to better represent what the agent is actually doing as it investigates — including a clearer view of which integrations it’s using, and when.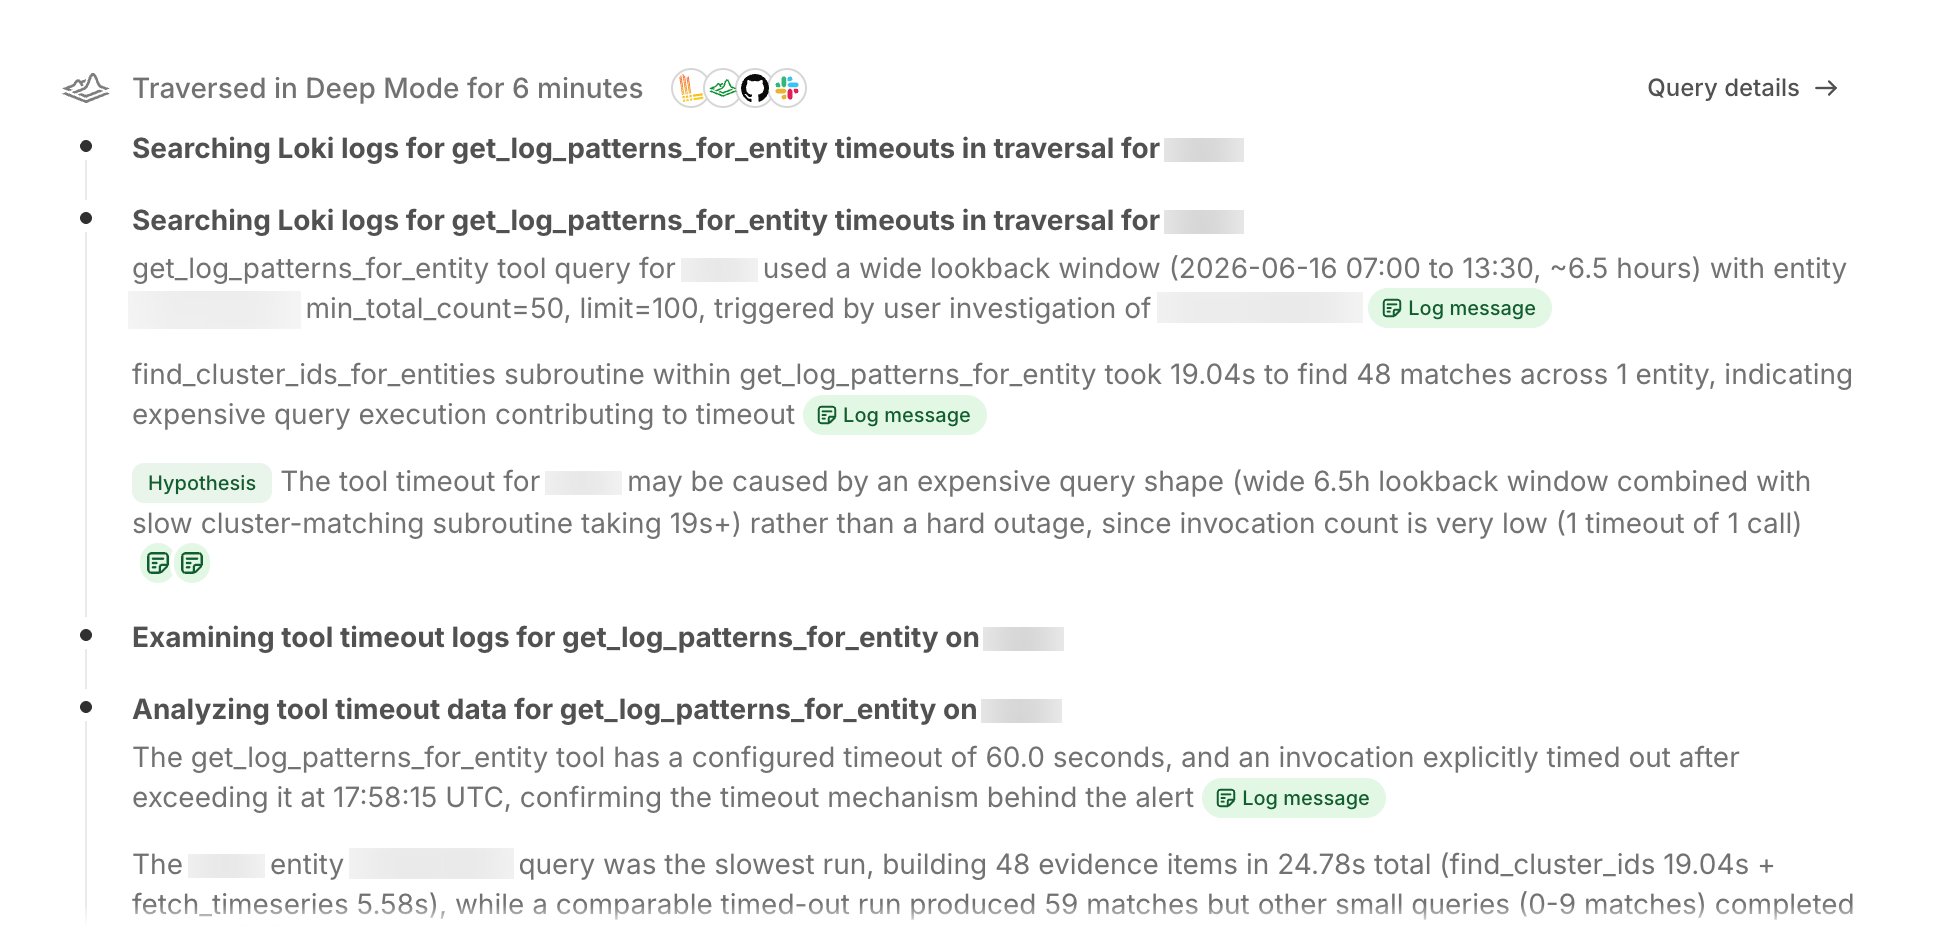
Web appUX/UI
Redesigned login page
Your first touchpoint with Traversal got a full refresh — rebuilt on the new design system for a cleaner, more modern first impression, consistent with the rest of the product.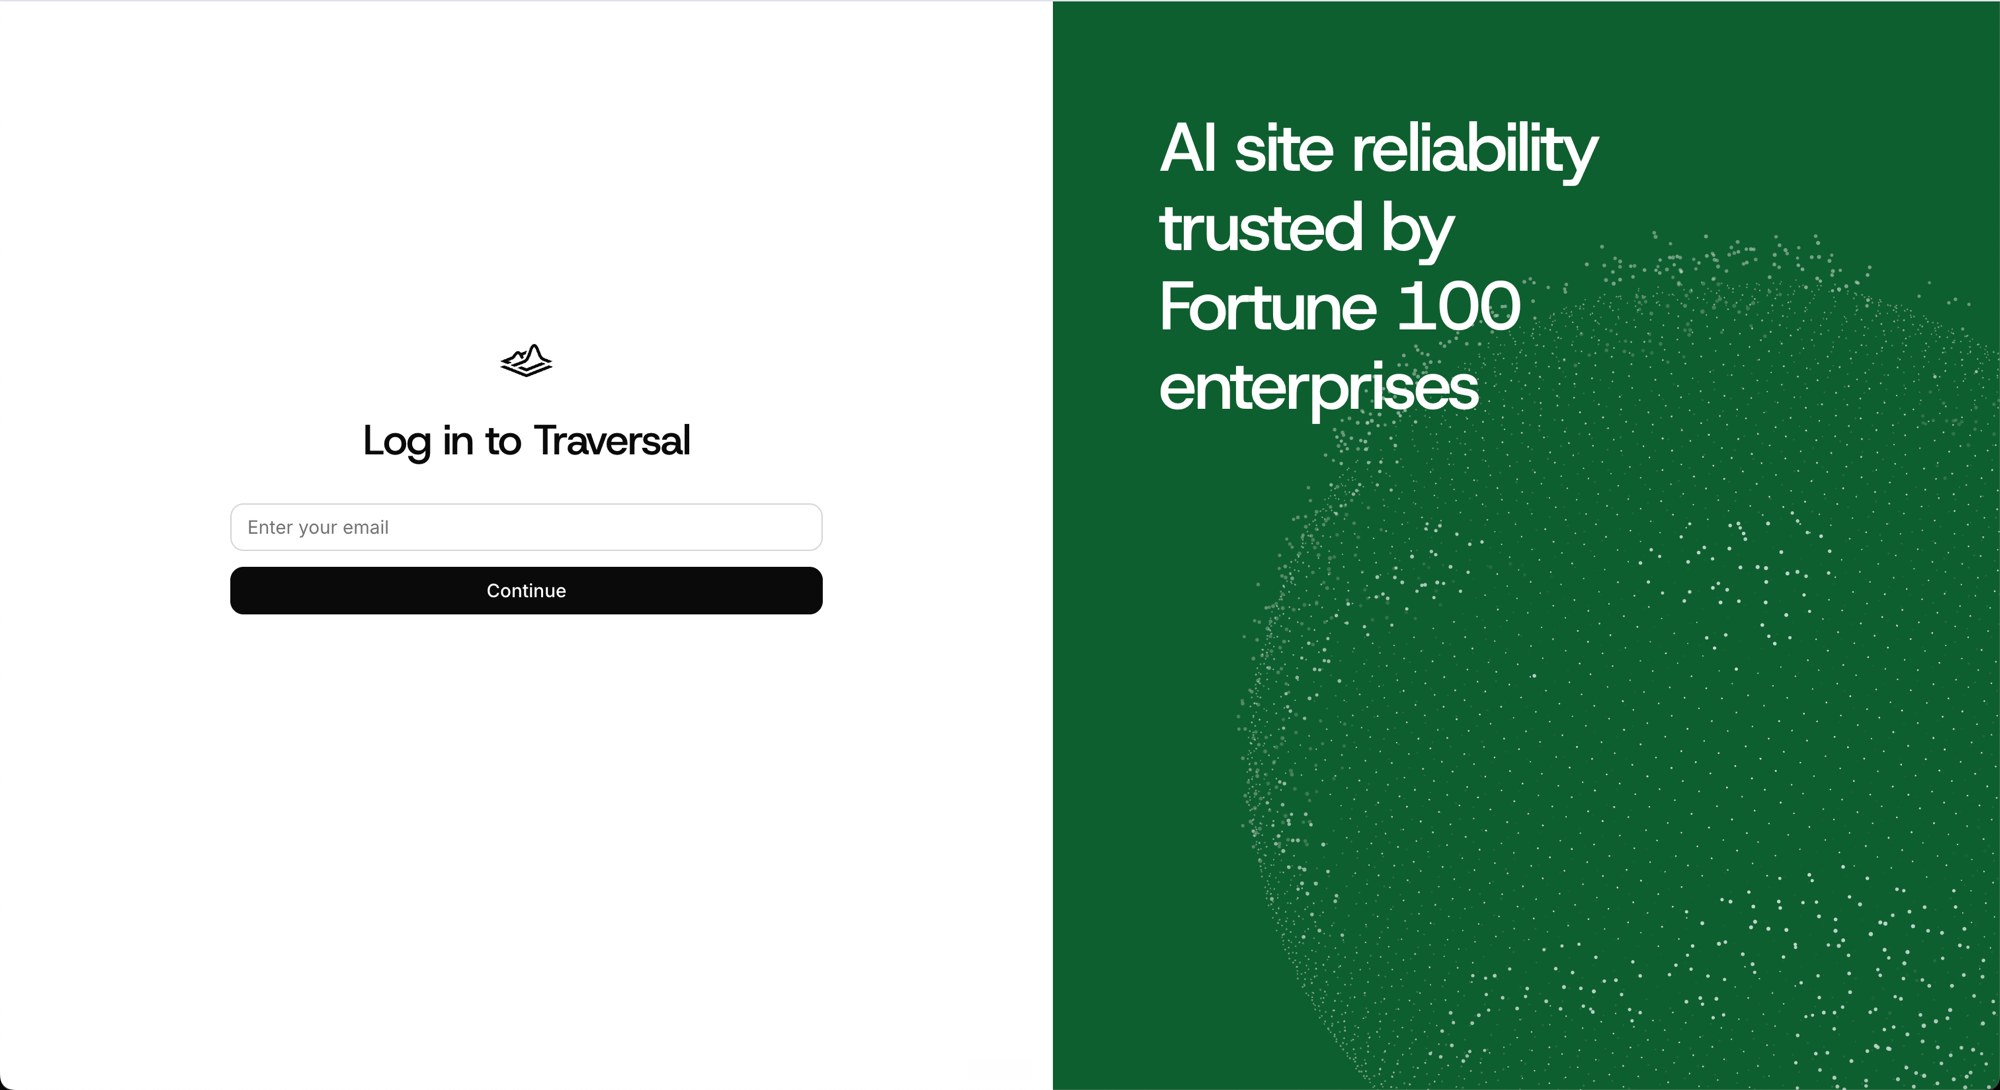
Web appUX/UI
A new design system
We’ve rolled out a new design system across every page of the product — a more open, modern feel with lighter borders and larger corner radii. We also refined the color palette and sharpened legibility throughout, including a polished dark mode. It’s especially noticeable on the home page and the session view, and in how we render code snippets.MCPInvestigations
Lightning mode
A fast investigation path built for the rapid back-and-forth of agent-to-agent work over MCP. A first pass typically returns in 30 seconds to two minutes — fast enough for a real conversation between your agent and Traversal rather than a single slow round trip. You can always follow up to go deeper.Alert IntelligenceSlack
Tune the definitions of noisy alerts
When Alert Intelligence flags an alert as noise, its response now includes a Tune Alert Definition button. Click it and Traversal drafts an updated alert definition — the specific change that stops the alert from firing on non-issues — ready for you to review and apply.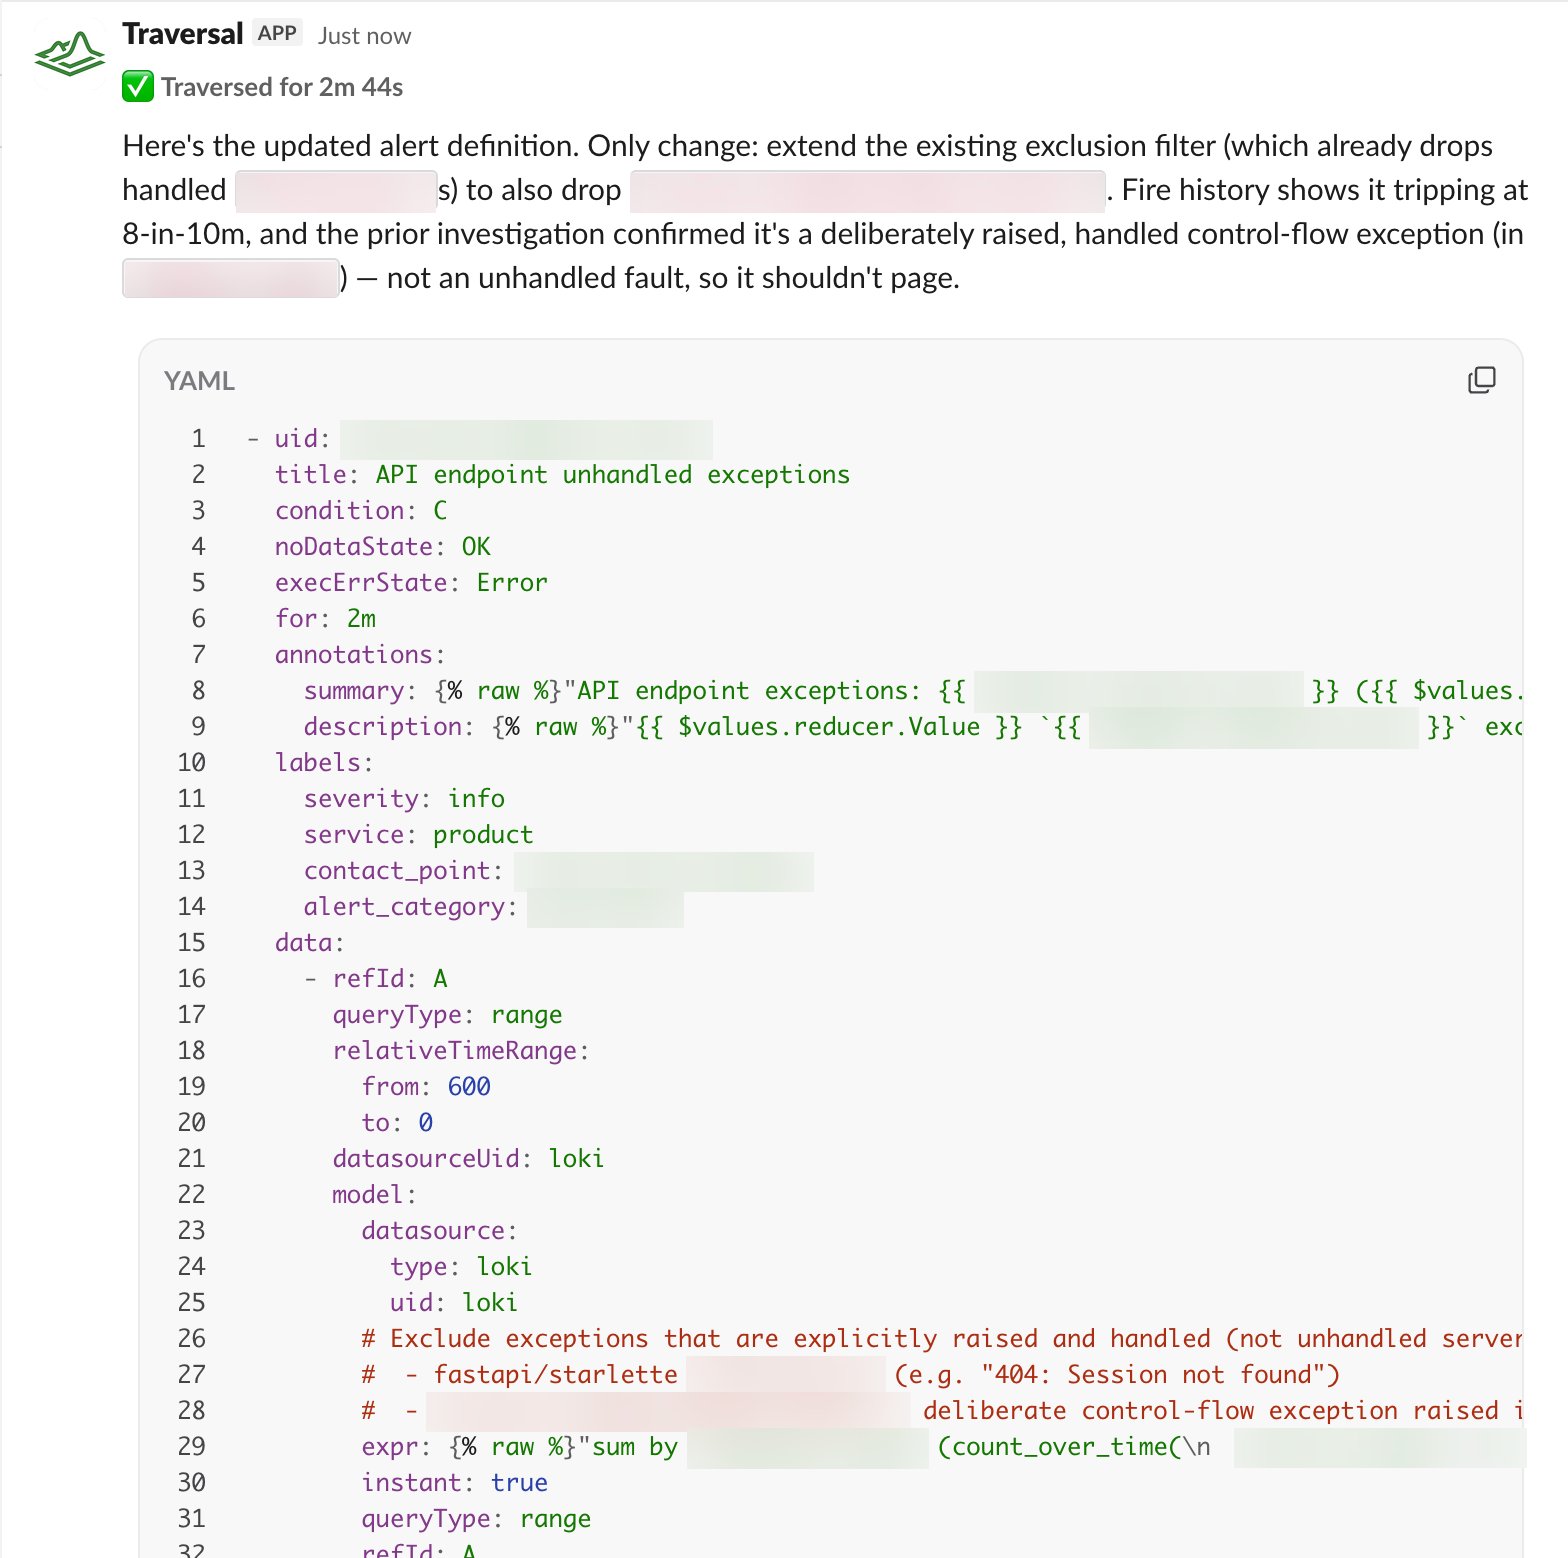
ConnectorSecurity
PrivateLink connectivity
Connect your environment to Traversal over AWS PrivateLink so traffic between your network and your Traversal deployment stays on the AWS backbone and never crosses the public internet. Paired with the outbound-only Connector, it gives you a fully private data path — no public endpoints, nothing exposed. See PrivateLink.ConnectorSecurity
Traversal Connector
A lightweight, outbound-only service you deploy in your environment that lets Traversal securely reach your private data sources — databases, internal APIs, and on-prem observability — without any inbound access. It opens a single encrypted, outbound tunnel, so there are no inbound firewall rules to manage and nothing in your network is exposed or listening for external traffic. It runs entirely in your environment, under your operational control. See the Traversal Connector.ProcessorSecurity
Redaction with the Processor
The Traversal Processor runs alongside the Connector in your environment and redacts sensitive data — PII, secrets, customer identifiers, or any fields you define — before it ever leaves your network. You own the rules (regex patterns and structured JSON keys), so Traversal only ever receives what you’ve explicitly allowed, and sensitive values never reach our control plane.InvestigationsUX/UI
Request analysis
When an investigation traces a request across services, Traversal now renders an inline request-analysis component right in its answer — a visual diagram of the request’s path across services, where it broke, and the errors behind each hop, alongside the key logs. Because it can pull from many log indices at once, you can see exactly where in a request an issue arose — the failing hop, the service, and the error in context.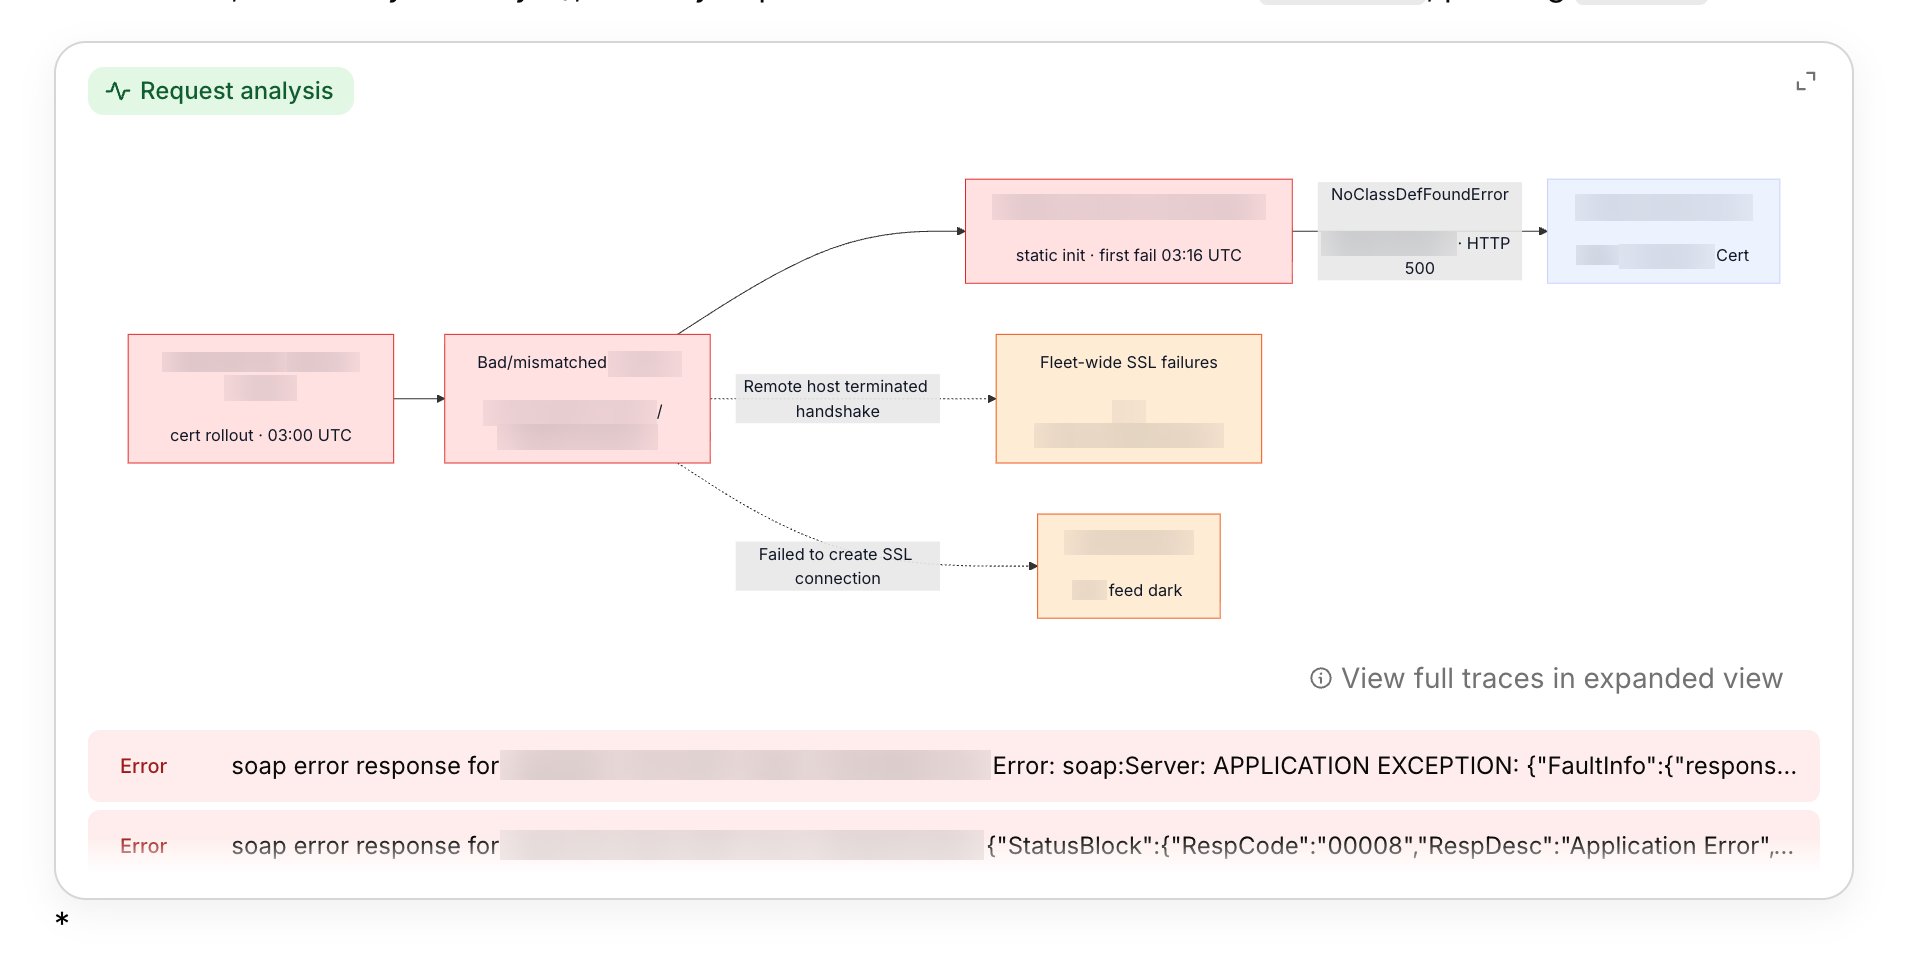
APISecurity
Personal API keys
Create and manage your own API keys from settings to authenticate with the Traversal API and the MCP server.Alert IntelligenceSlack
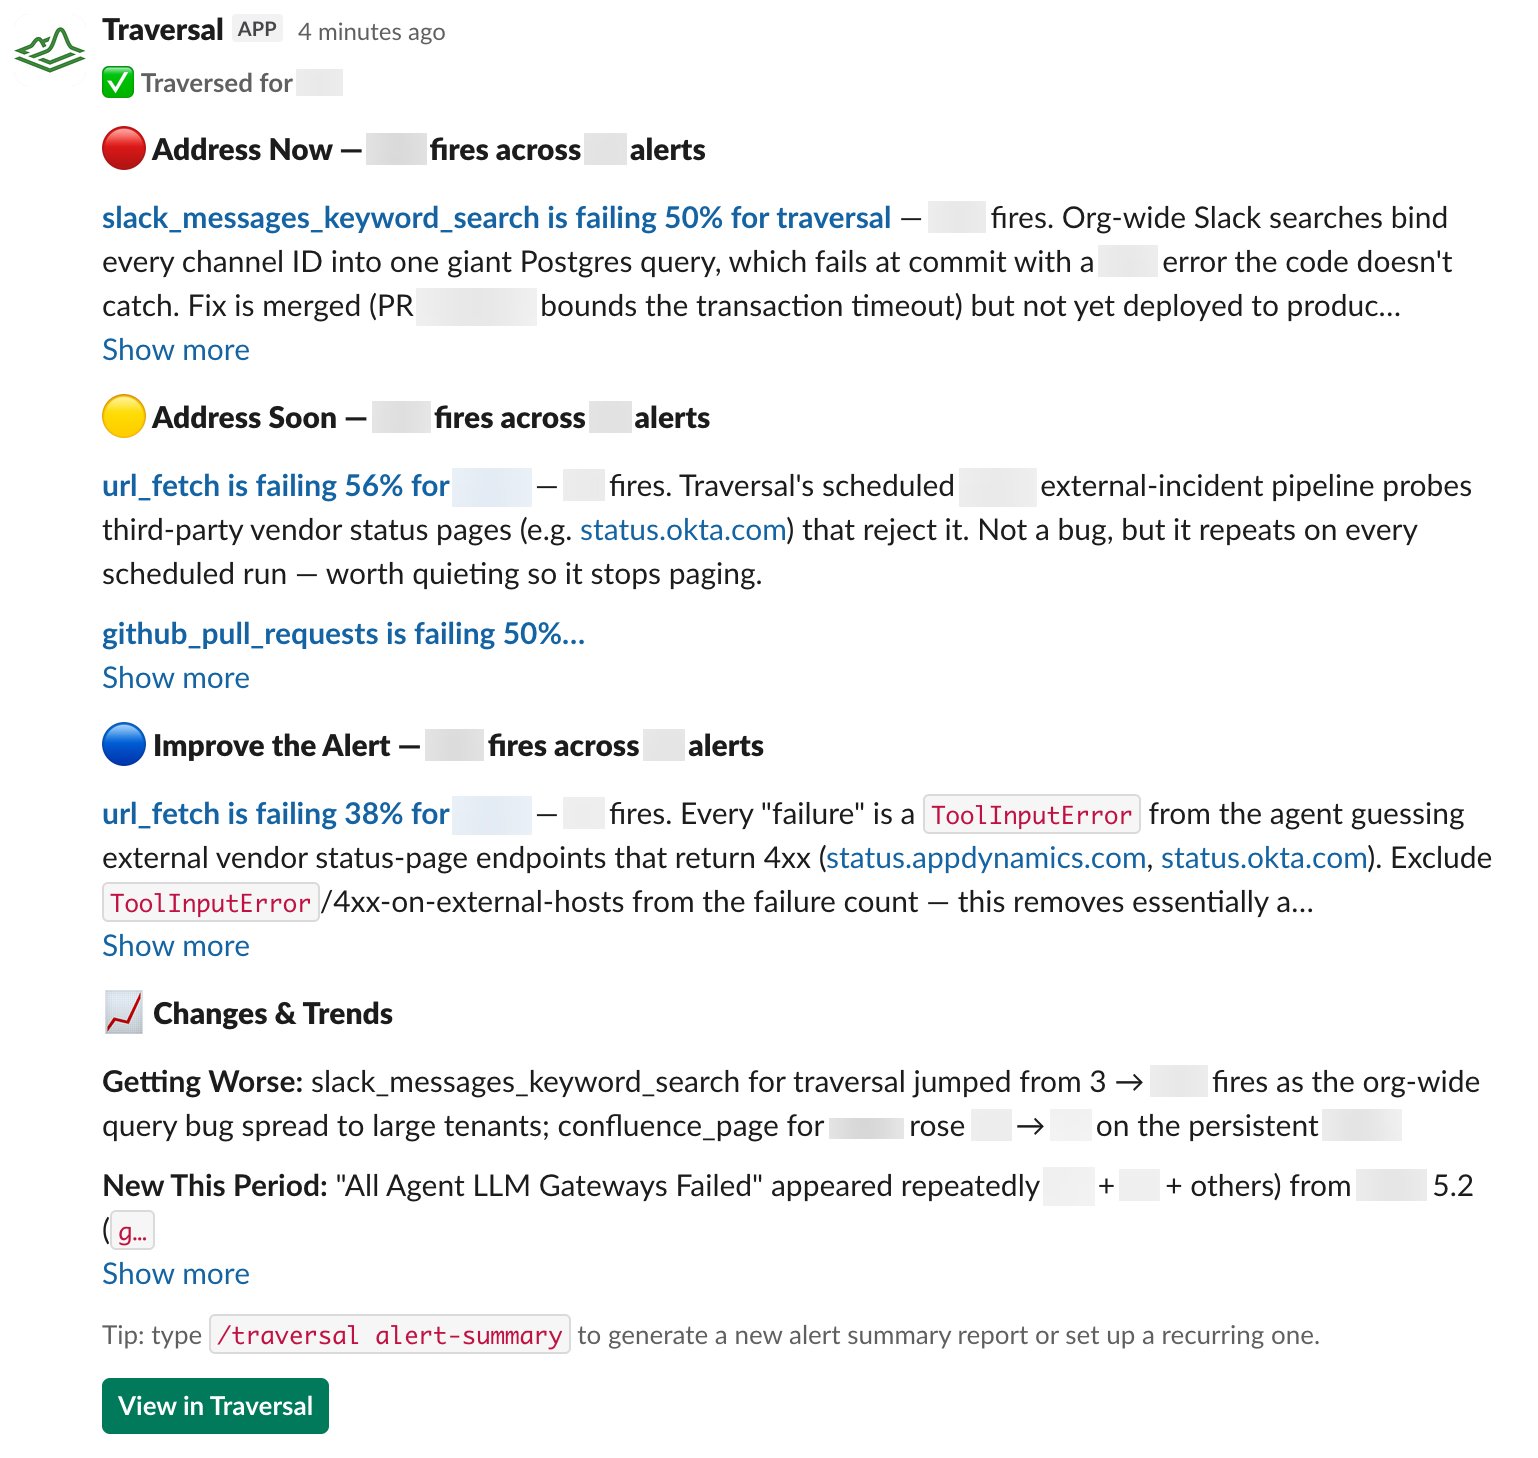
Alert summary reports
Run/traversal alert-summary in any alert channel to generate an insights
report over a time period you choose — a digest of what fired, how often, and
what’s worth attention — so you can spot noisy monitors and recurring issues at
a glance.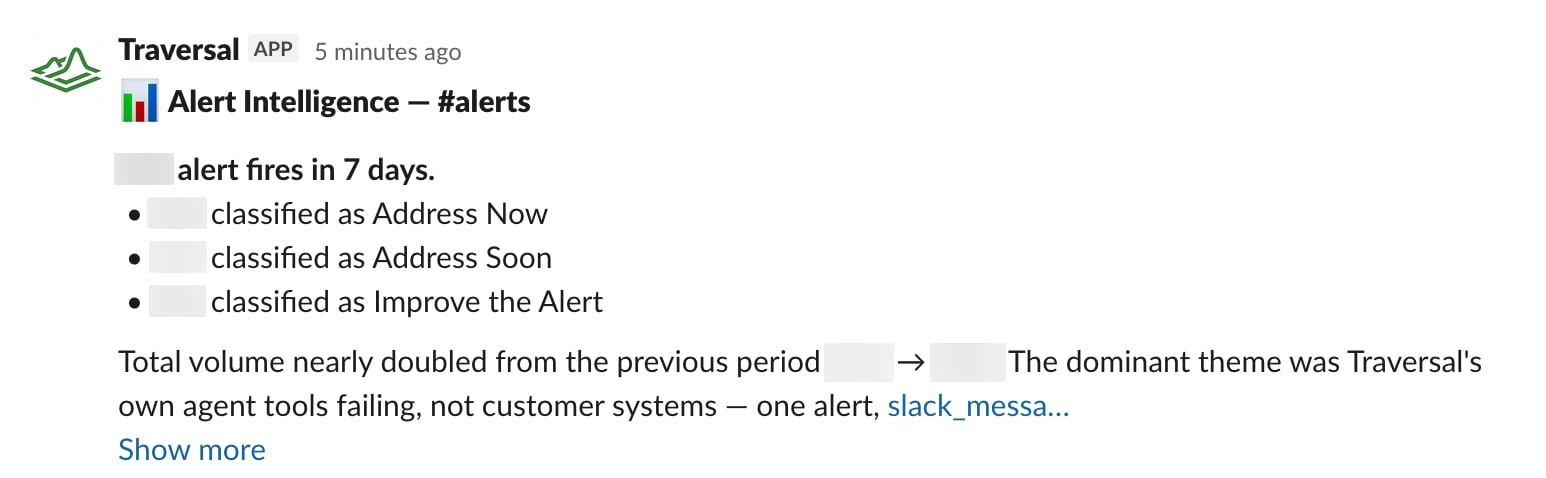
Alert IntelligenceSlack
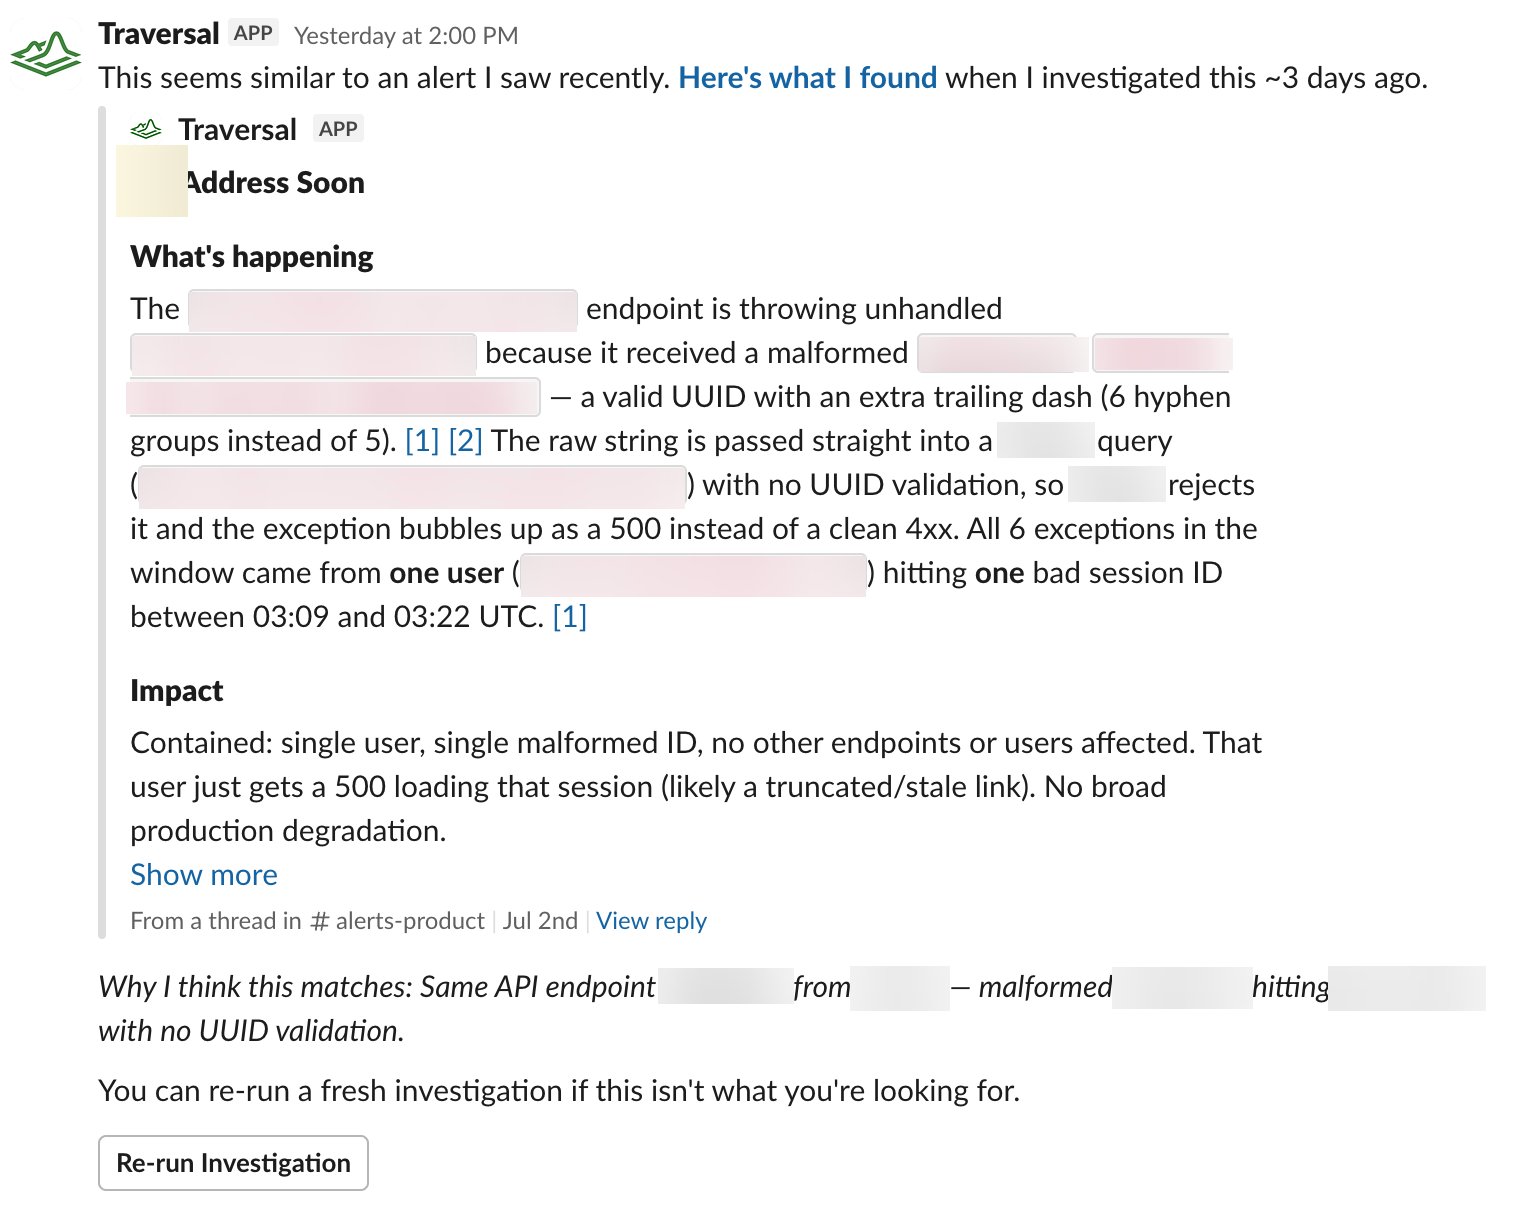
Alert Intelligence
Traversal now replies to every alert in the Slack channels it watches with an assessment — how urgent it is and why, and, for alerts that are just noise, how to tune them. You never have to tag anything.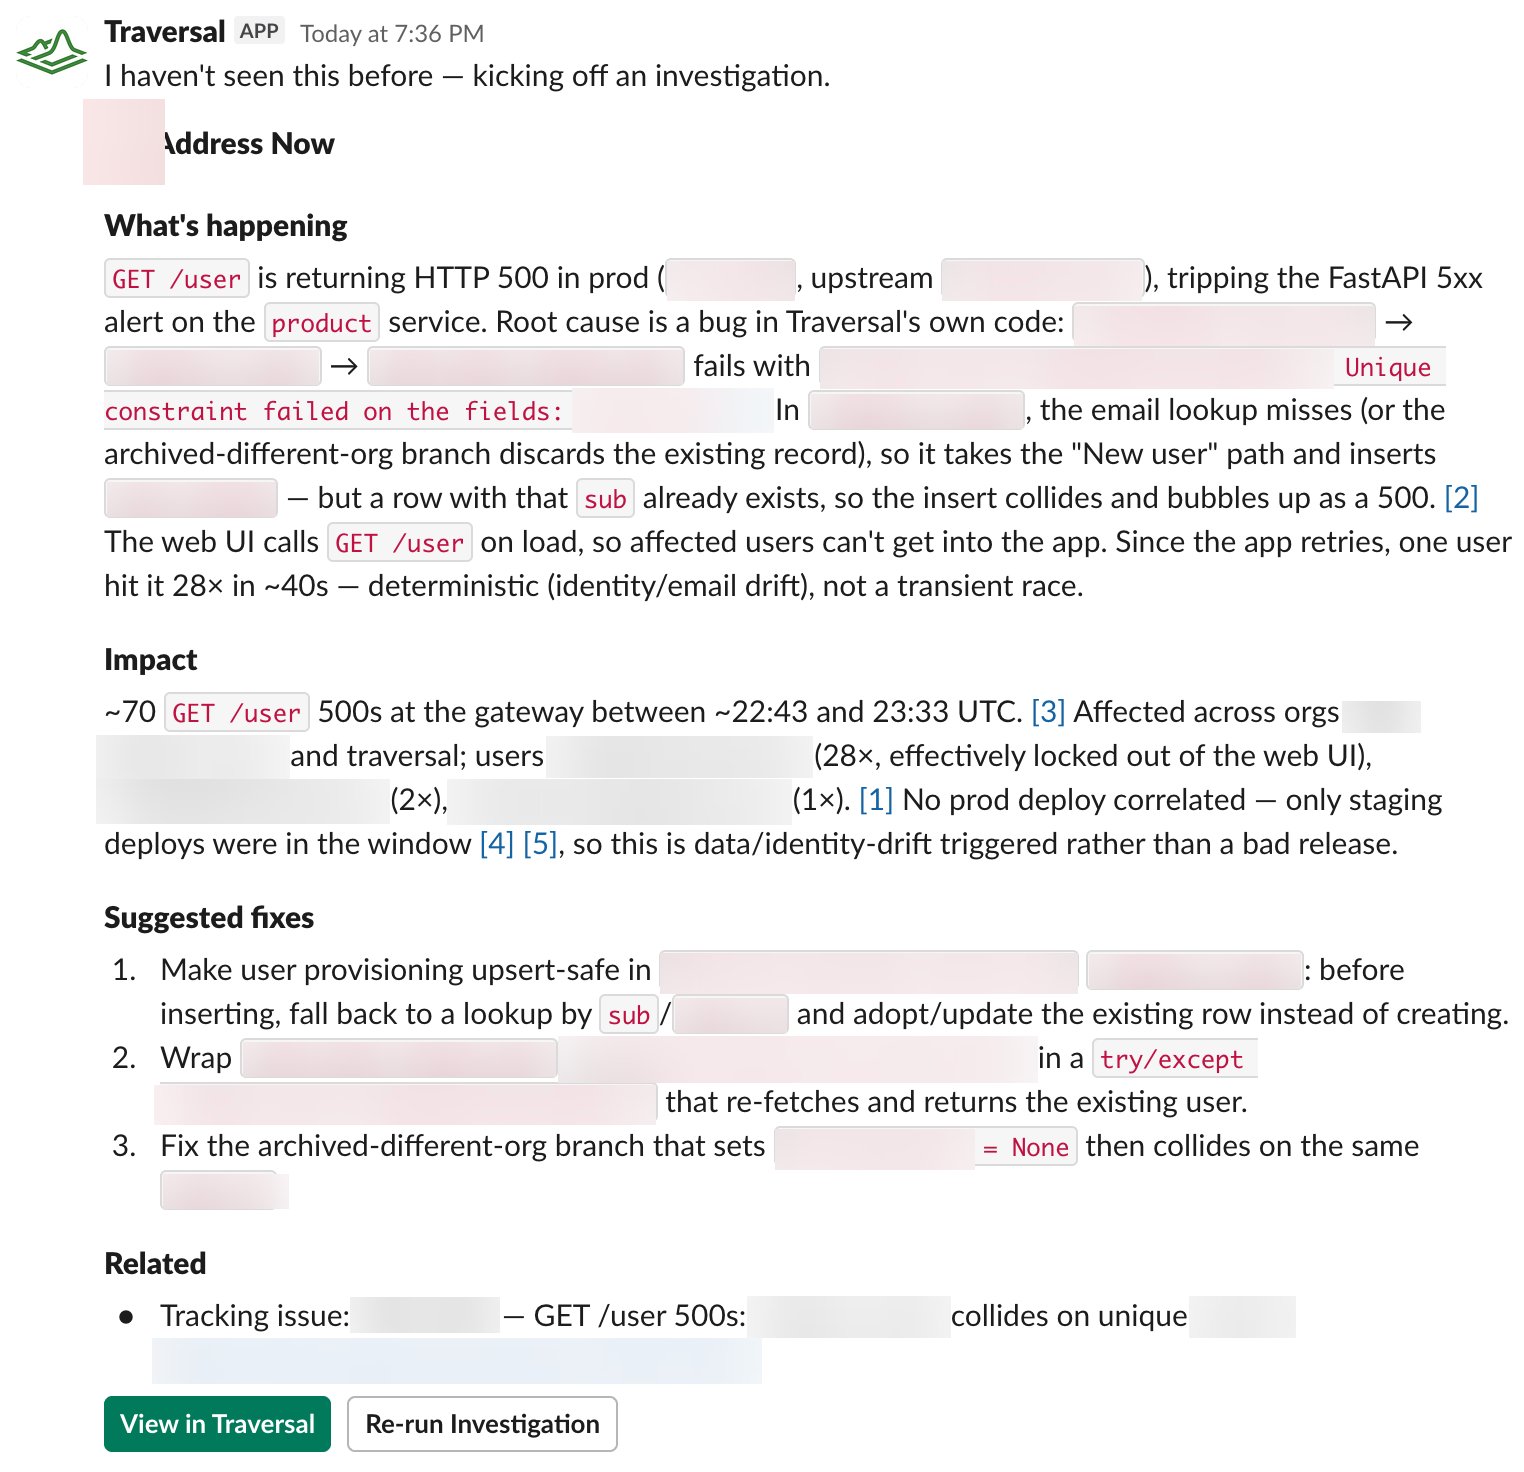
API
Programmatic investigations (Sessions API)
Kick off investigations, ask follow-ups, and pull results entirely over HTTP with a self-service API key — the same capabilities you get in the app, now available to your own scripts, runbooks, and internal tools. See the API reference.IntegrationsWeb appUX/UI
Easier integration setup
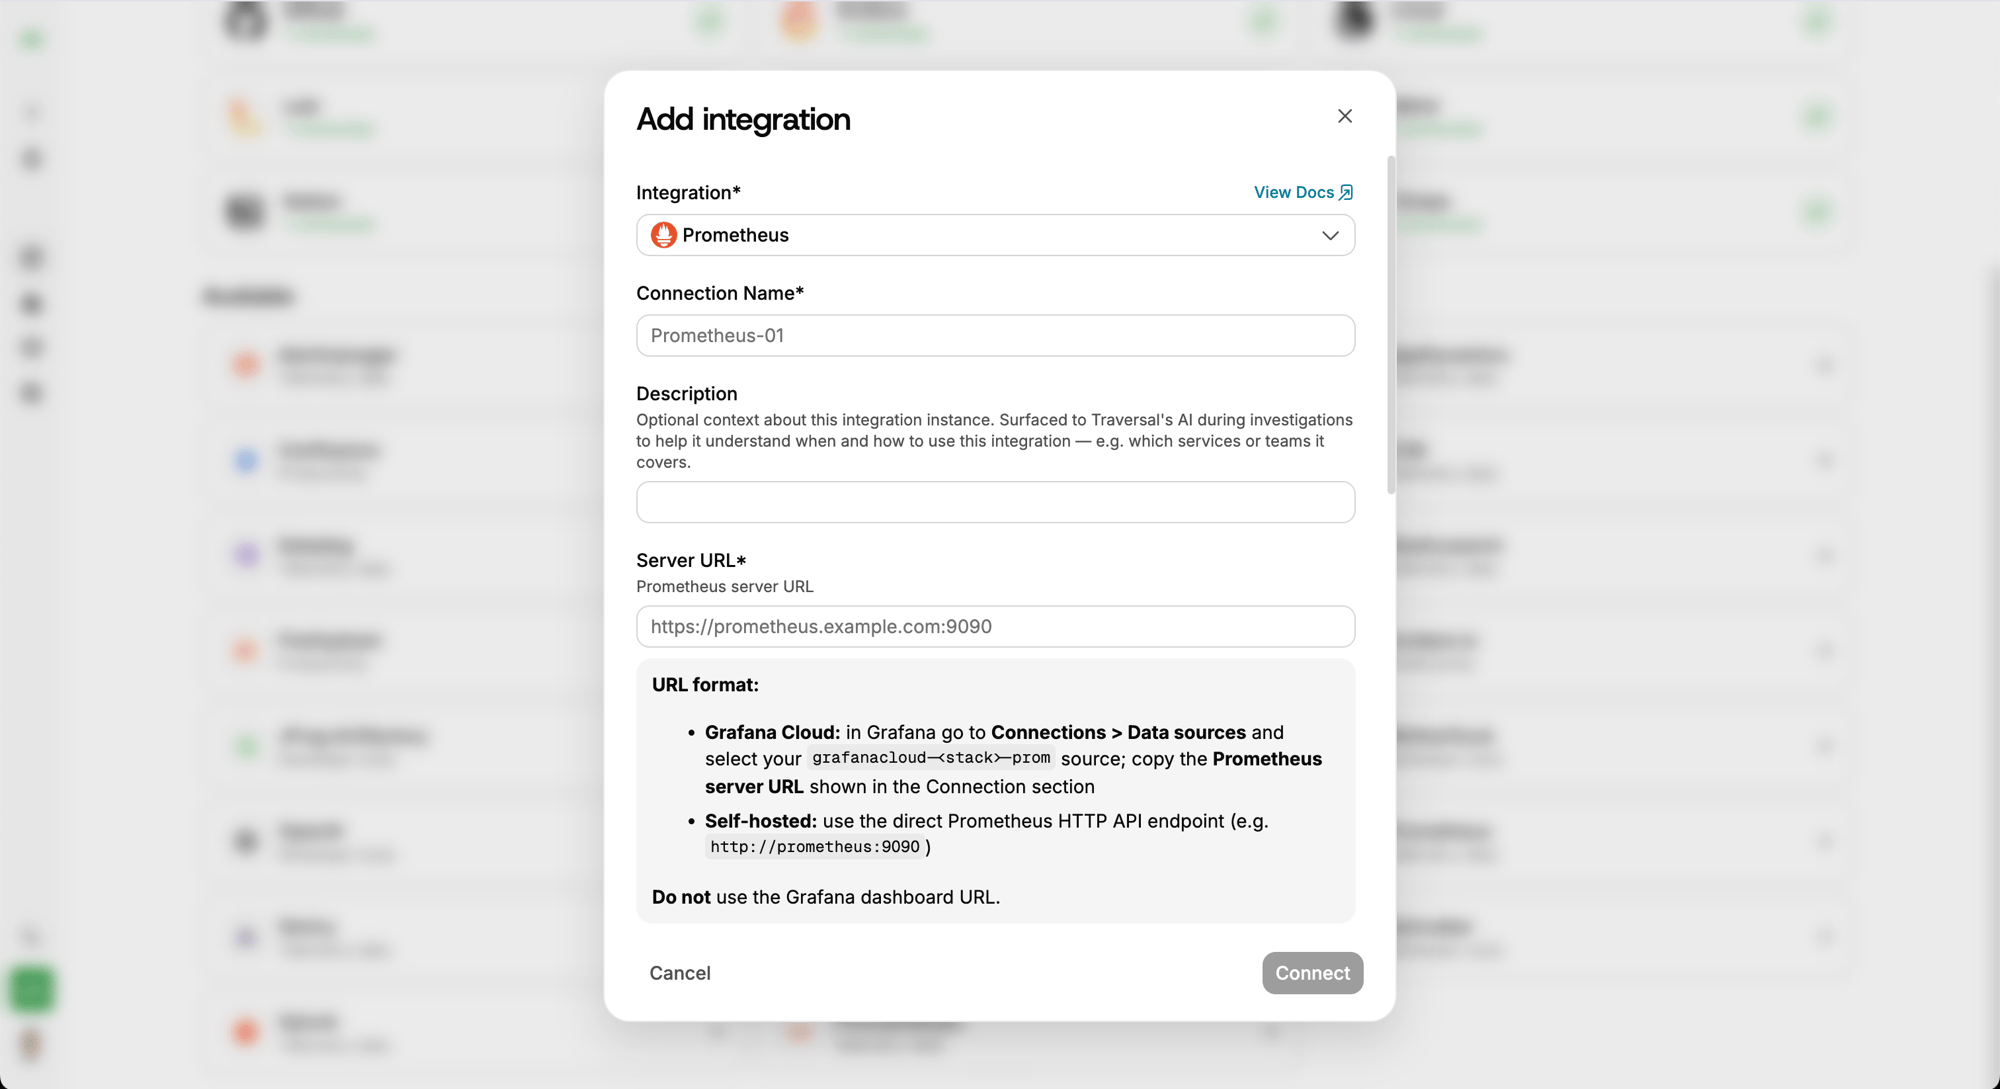
Connecting a data source is more self-serve: every integration shows a live connection-health badge, credentials are verified the moment you connect (and rolled back if they fail), and you can test a query against a connected integration right from settings.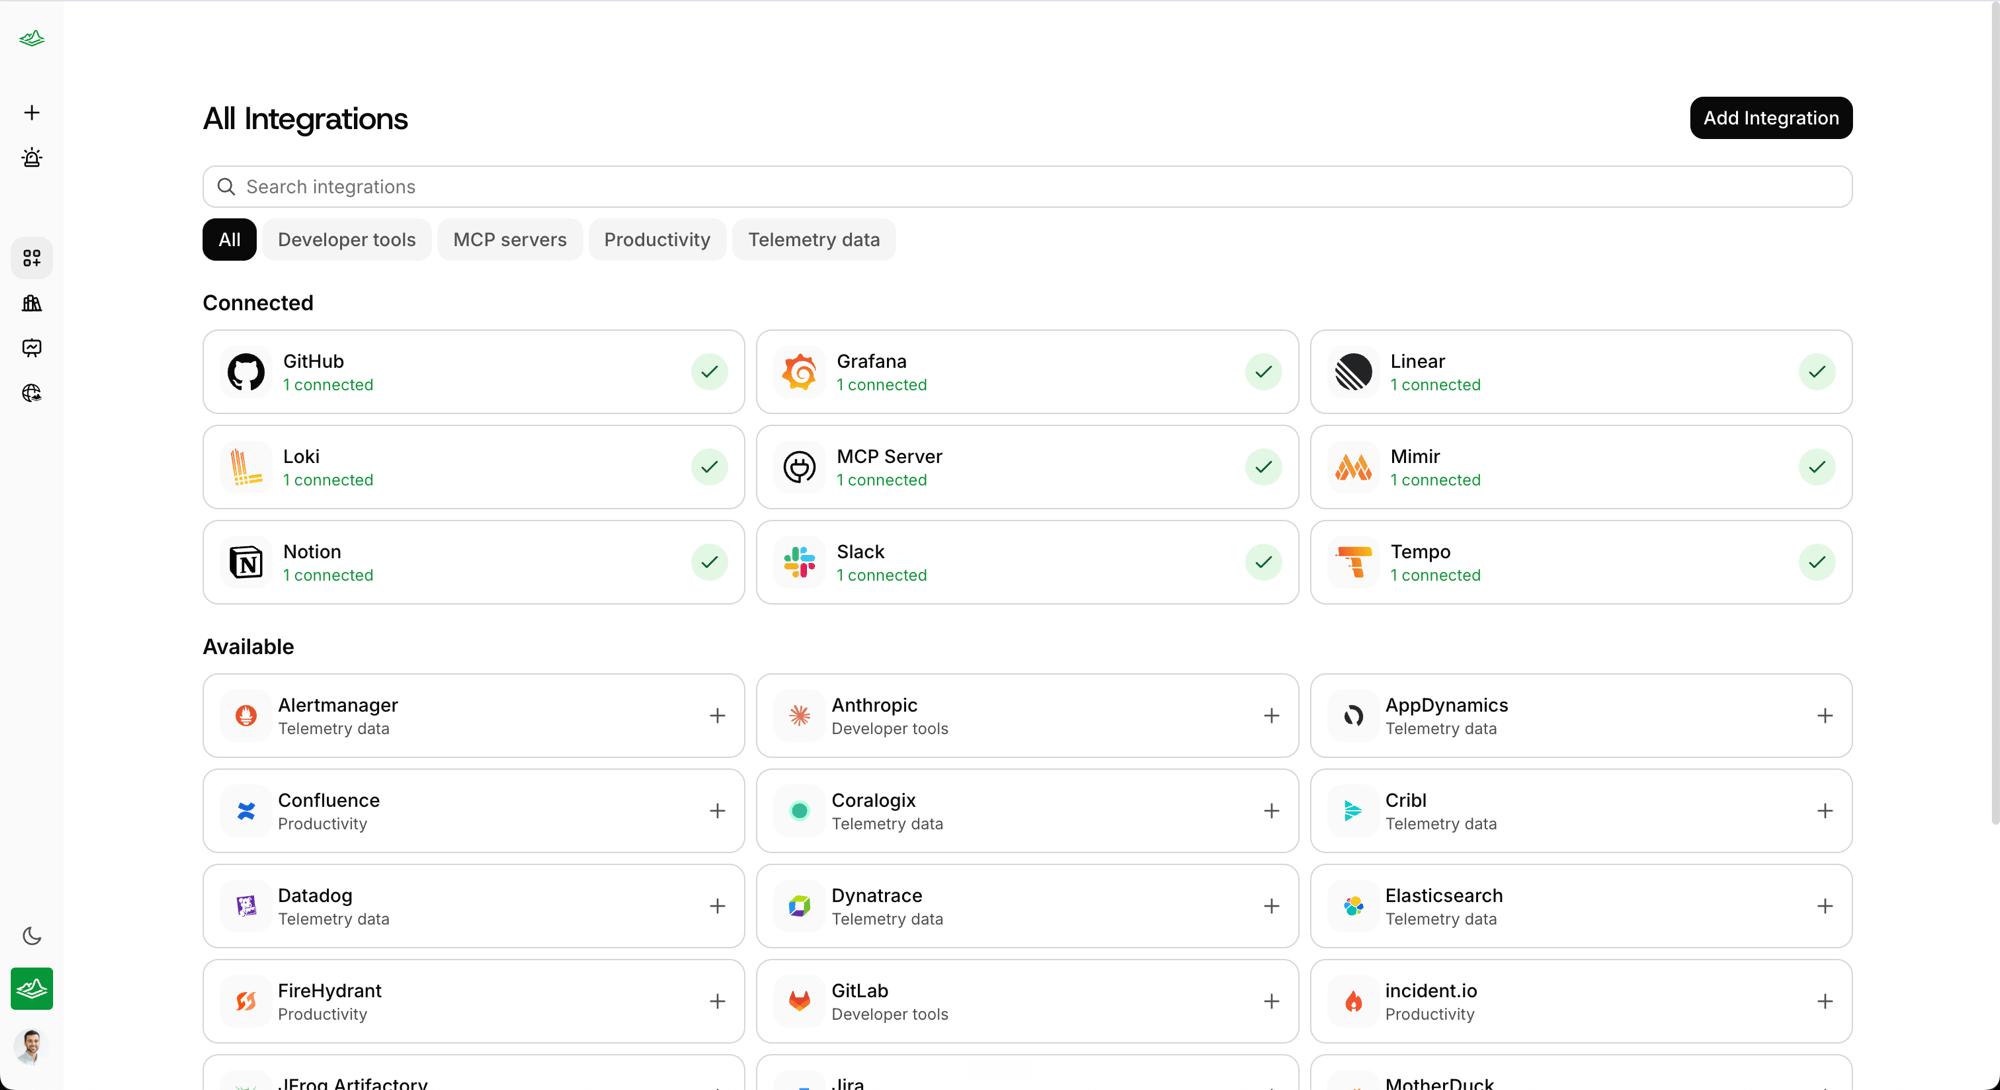
MCPAPI
Work with Traversal from your AI client (MCP)
The Traversal MCP server lets any compatible AI client — Claude Code, Cursor, Claude Desktop, and others — run investigations, ask follow-ups, and retrieve results. When called from another agent, Traversal acts as a peer your local agent works alongside, handing work back and forth until the incident is understood.Investigations
Post-mortems
Traversal produces a first-draft post-mortem so your team can skip the assembly work — reconstructing the timeline, writing up what happened, drafting follow-ups — and focus on the fixes. Generate one on demand by tagging Traversal. See post-mortems.Investigations